Challenger Underground MRE Doubles to 230koz @ 3.65 g/t Au
'Hub 1' Resources at Challenger & Tarcoola grow to total 400koz AuHIGHLIGHTSChallenger underground surprises with
Press Release Disclaimer: This is a press release distributed through the XPR Media network. It has not been independently verified by our newsroom.


‘Hub 1’ Resources at Challenger & Tarcoola grow to total 400koz Au
HIGHLIGHTS
- Challenger underground surprises with 230koz Au on existing mine development; significant growth potential indicated with expedited review of development options to commence
- Total Challenger JORC (2012) Mineral Resources Estimate (MRE) grows to 370koz Au (11.2Mt @ 1.03 g/t), incl. 246koz Au (2.17Mt @ 3.53 g/t) in existing open pit and underground areas:
- Challenger Main Open Pit: 13,900oz Au (0.20Mt @ 2.16 g/t Au);
- Challenger West Open pit: 2,400oz Au (0.01Mt @ 6.09 g/t Au);
- Challenger Underground (above 215mRL): 206,800oz Au (1.75Mt @ 3.68 g/t Au); and
- Challenger Deeps (below 90mRL): 23,000oz Au (0.21Mt @ 3.50 g/t Au).
- Existing Tarcoola stockpiles MRE (220Kt @ 1.23 g/t Au) upgraded to JORC ‘Indicated’ category
- Total 169koz Au open pittable ‘Hub 1’ Resources, including 62koz Au (1.41Mt @ 1.37 g/t) fresh mineralisation (52% Indicated) and 56koz Au (3.19Mt @ 0.54 g/t Au) in TSF1 (100% Indicated)
- Almost all MRE mineralisation located in, on, or adjacent to, existing serviceable open pit and underground development à opportunities for relatively low-cost access and production
- Includes new ‘Challenger 3′ Deposit confirmed along strike of Challenger ‘West’ and ‘Main’ pits; review indicates significant near-term growth potential for open-pittable ‘baseload’ mineralisation
- Definitive Feasibility Study (DFS) underway to evaluate capital and operating costs for potential Challenger operations restart leveraging existing, fully-permitted Central Gawler Mill (CGM)1
ADELAIDE, AU / ACCESS Newswire / October 27, 2026 / Barton Gold Holdings Limited (ASX:BGD)(FRA:BGD3)(OTC PINK:BGDFF) (Barton or Company) is pleased to announce updated MREs for each of its South Australian Challenger (Challenger) and Tarcoola (Tarcoola) Gold Projects.
Commenting on the Challenger & Tarcoola Resources update, Barton MD Alexander Scanlon said:
“Detailed remodelling of the Challenger high-grade underground has surprised to the upside, with Resources more than doubling to 230koz @ 3.65 g/t Au. This mine has extensive existing development and produced over 1 million gold ounces from 2002 to 2018. Third party review indicates significant growth potential through near-mine drilling.
“Barton is steadily building its platform, with Challenger and Tarcoola JORC Resources now totalling 400,000oz Au. This mineralisation has also now been modelled on a more conservative basis and constrained to optimised pit shells, increasing the potential for these materials to support a future ‘Hub 1′ operation based at our Challenger project site.
“Our fully permitted Central Gawler Mill offers considerable infrastructure leverage with a potentially shorter, lower-cost, and lower-risk pathway to operations. Reanimation of the mill would also materially enhance the development optionality of our adjacent Challenger underground mine, and our regional assets Tarcoola, Tolmer, and Wudinna.”
1 Refer to Prospectus dated 14 May 2021
Updated Challenger JORC (2012) MRE
The new Challenger MRE reflects the original open pit (Challenger Main), the ‘West’ open pit (Challenger West), the ‘SSW’ Deposit (CSSW), historical Tailings Storage Facilities 1 and 2 (TSF1 and TSF2, respectively) the historical Challenger underground mine (UG), and a newly defined Challenger 3 Deposit (Challenger 3 or C3).2
All mineralisation is adjacent to the Company’s Central Gawler Mill (CGM). The updated MRE excludes various lower-grade stockpiles and higher-grade mill residuals (eg. ball mill rejects) which are located adjacent to the CGM on the Run of Mine (ROM) pad. These materials will likely also form a component of early mill feed as the hard rock crushing and grinding circuits are recommissioned for the start of fresh rock processing operations.
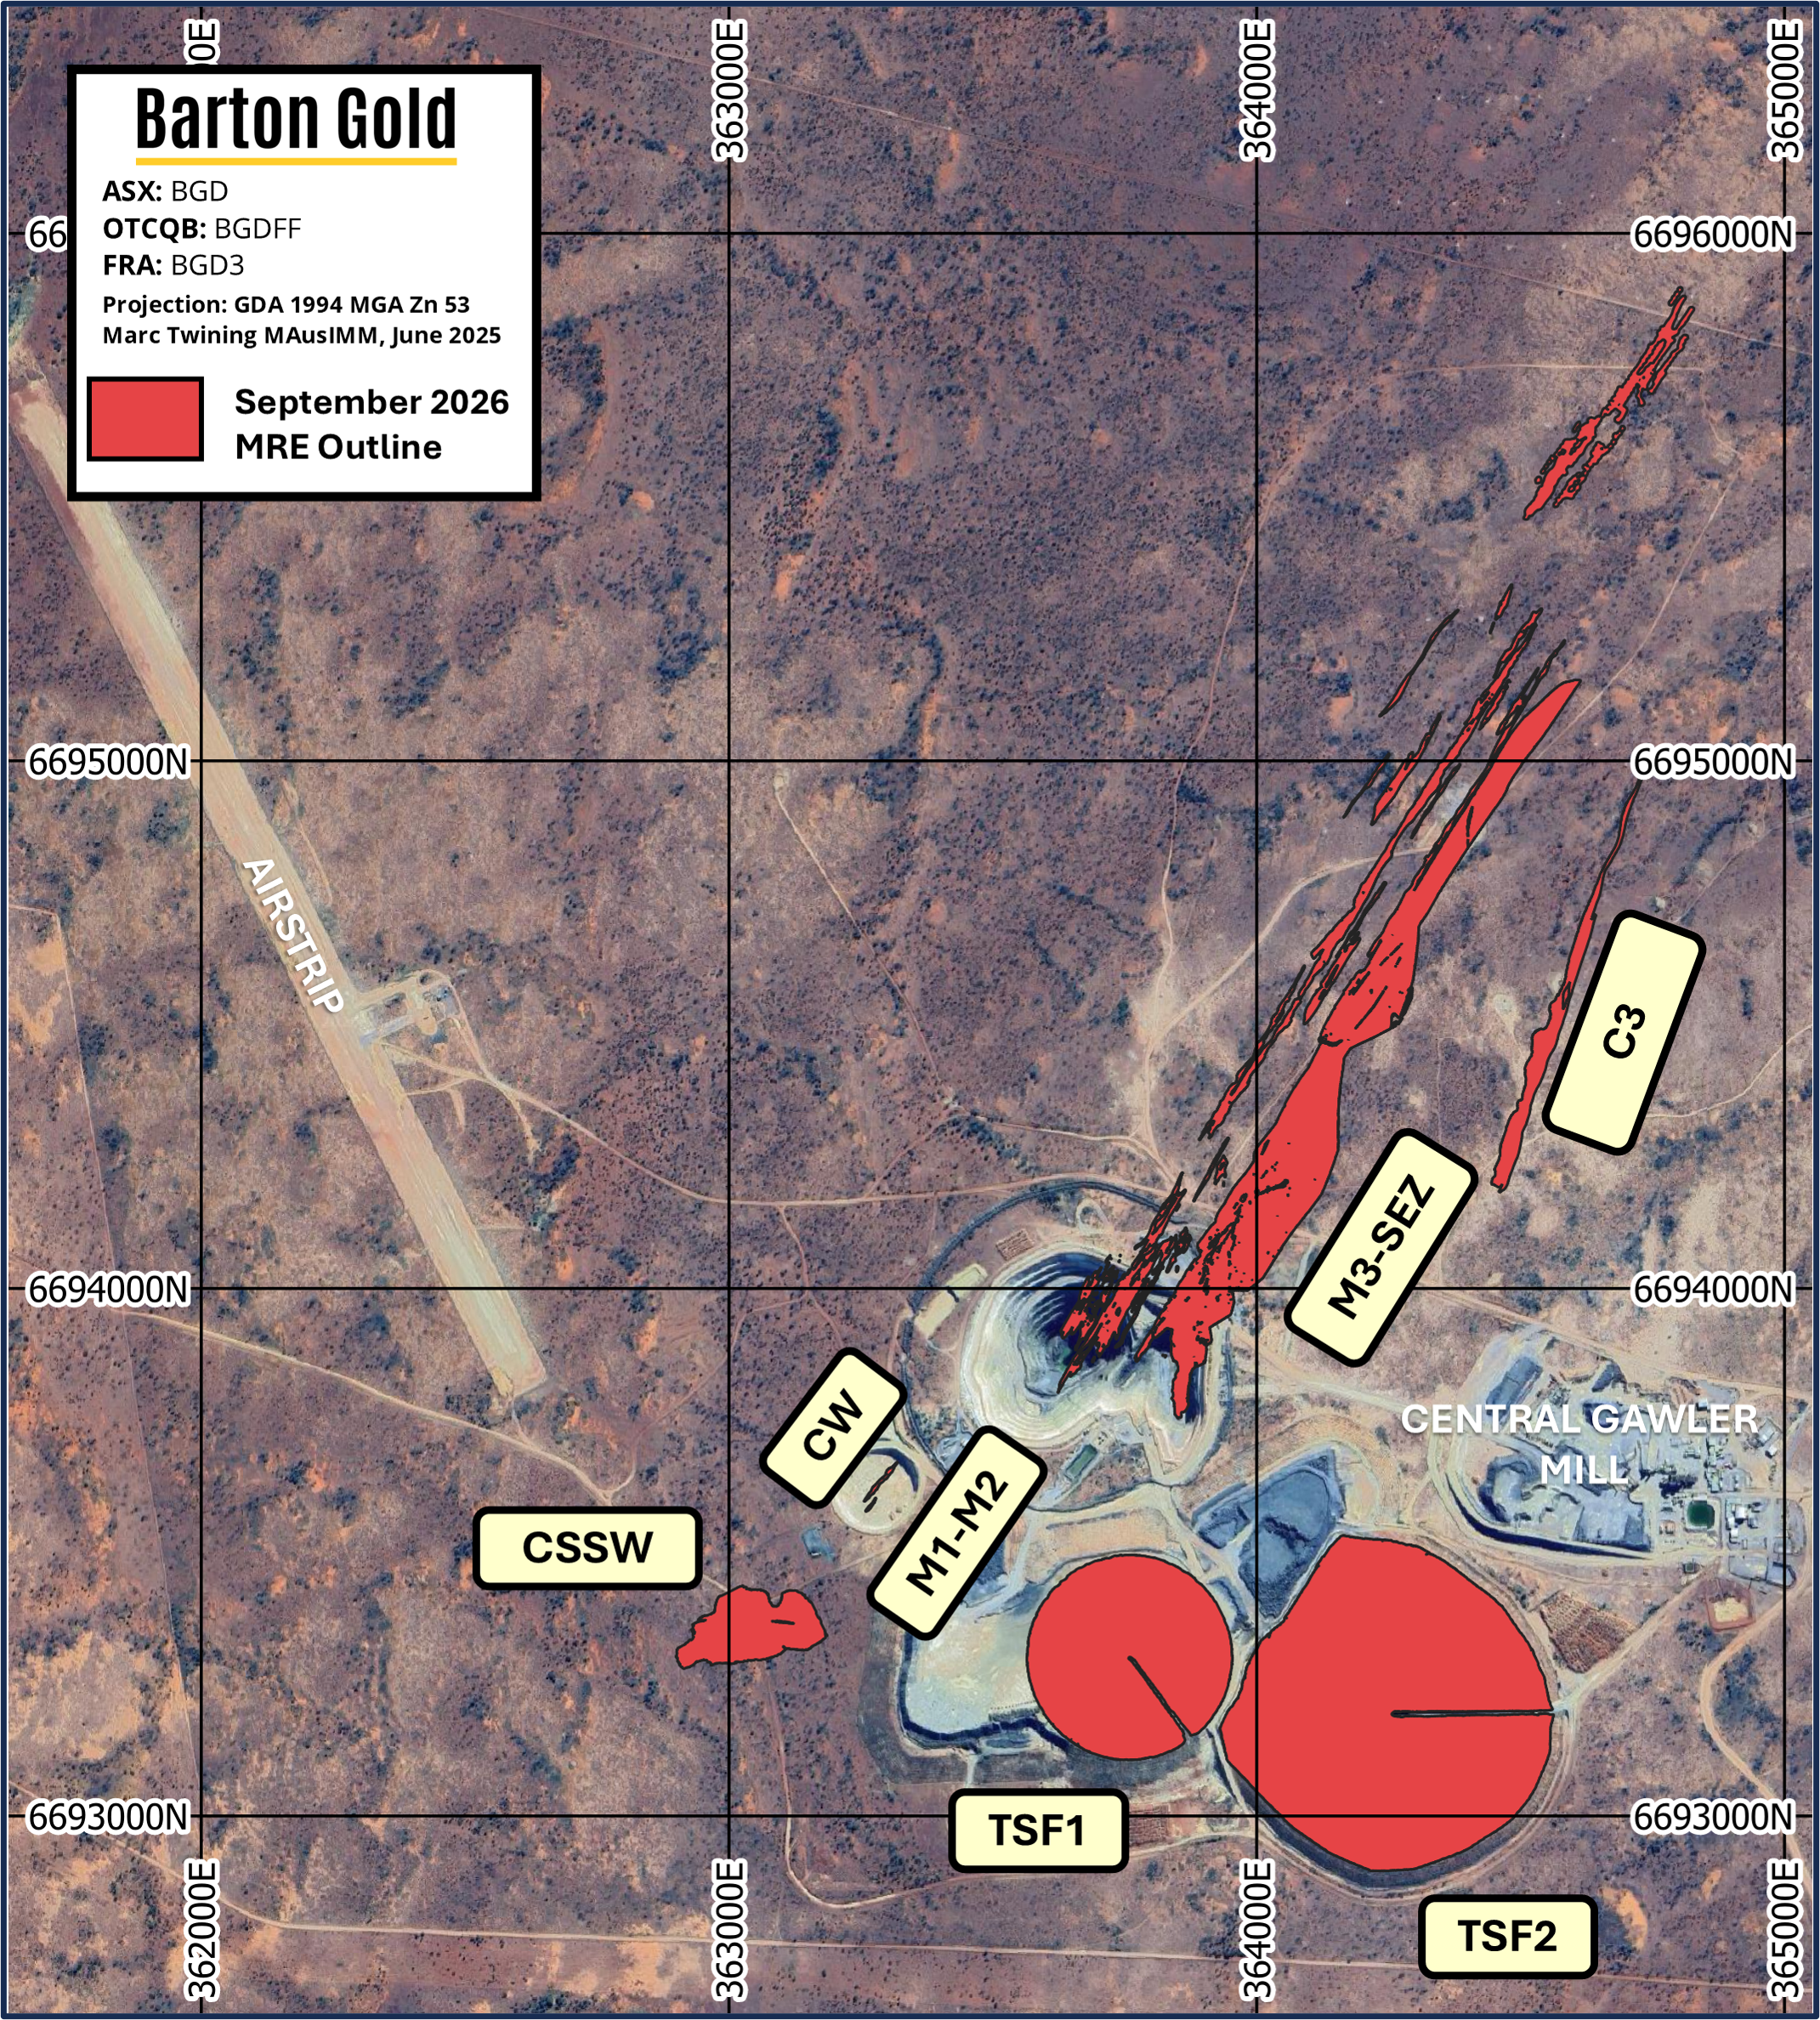
Figure 1 – Challenger site map with locations of key infrastructure and JORC (2012) MRE deposits
2 Refer to Prospectus dated 14 May 2021
Comparison with prior Challenger JORC (2012) MRE
Challenger’s updated JORC (2012) MRE (see Table 1 below) is based upon the integration of 9,387m new reverse circulation (RC) and diamond (DD) drilling results.3 Key modelling updates and outcomes include:
- the confirmation of a new open-pittable ‘Challenger 3’ Deposit along strike of the existing open pits;
- remodelling of ‘open pittable’ Resources on a more conservative basis by constraining mineralisation to optimised open pit shells with revenue factors from 1.2 to 1.5 (base gold price of AUD $5,000 / oz);
- remodelling of underground mineralisation following further on-site review by third party consultants, including some mineralisation previously modelled as Challenger ‘Main’ open pit JORC Resources.
In particular, underground mineralisation has surprised to the upside with significant mineralisation added into the block model and Resources more than doubling to 230koz @ 3.65 g/t Au. A material grade improvement has also been observed where mineralisation previously modelled as ‘open pit’ Resources has been reclassified to ‘underground’ Resources with a view to more efficient and selective extraction.
Preliminary modelling by SRK Consulting Pty Ltd (SRK) has also indicated potential to bring significant additional high-grade mineralisation into a future MRE or mine plan through further near-mine drilling. An expedited review of potential underground development options is expected to commence shortly.
Additionally, a new ‘Challenger 3’ Deposit has been defined along strike of the CSSW Deposit and the existing Challenger ‘West’ and ‘Main’ open pits. Review indicates potential for additional growth through infill drilling (conversion of unclassified mineralisation) and growth / extensional drilling along strike of the new MRE.
| Zone |
Measured |
Indicated |
Inferred |
TOTAL |
||||||||
|
Mt |
g/t Au |
Koz Au |
Mt |
g/t Au |
Koz Au |
Mt |
g/t Au |
Koz Au |
Mt |
g/t Au |
Koz Au |
|
| Challenger Underground (above 215mRL) |
— |
— |
— |
0.11 |
4.82 |
17 |
1.64 |
3.60 |
190 |
1.75 |
3.68 |
207 |
|
Challenger Deeps (below 90mRL) |
— |
— |
— |
— |
— |
— |
0.21 |
3.50 |
23 |
0.21 |
3.50 |
23 |
| Challenger Main Open Pit |
— |
— |
— |
0.15 |
2.23 |
10 |
0.05 |
1.94 |
3 |
0.20 |
2.15 |
14 |
| Challenger West Open Pit |
— |
— |
— |
0.01 |
6.66 |
2 |
0.00 |
3.3 |
0.2 |
0.01 |
6.1 |
2 |
| Challenger SSW Deposit |
— |
— |
— |
0.18 |
0.86 |
5 |
0.20 |
0.69 |
4 |
0.38 |
0.77 |
9 |
| Challenger 3 Deposit |
— |
— |
— |
0.21 |
0.89 |
6 |
0.07 |
0.68 |
1.63 |
0.29 |
0.84 |
8 |
| Tailings Storage Facility 1 |
— |
— |
— |
3.19 |
0.54 |
56 |
— |
— |
— |
3.19 |
0.54 |
56 |
| Tailings Storage Facility 2 |
— |
— |
— |
5.13 |
0.31 |
52 |
— |
— |
— |
5.13 |
0.31 |
52 |
| TOTAL |
— |
— |
— |
8.98 |
0.51 |
148 |
2.17 |
3.18 |
222 |
11.2 |
1.03 |
370 |
| * Totals subject to rounding; tonnages are dry metric tonnes; all Mineral Resources classified as ‘Inferred’ are approximate; cut-off grades applied are 2.0 (Deeps) 1.0 g/t Au (UG above 215 mRL), 0.3 g/t Au (Main Open Pit, Challenger West, SSW, Challenger 3) and 0.0 g/t Au (TSF1 and TSF2). | ||||||||||||
Table 1 – Challenger JORC (2012) Mineral Resources Estimate (October 2026)
The prior Challenger JORC (2012) MRE, reported on 8 September 2025, was:4
| Zone |
Measured |
Indicated |
Inferred |
TOTAL |
||||||||
|
Mt |
g/t Au |
Koz Au |
Mt |
g/t Au |
Koz Au |
Mt |
g/t Au |
Koz Au |
Mt |
g/t Au |
Koz Au |
|
| Challenger Underground (above 215mRL) |
— |
— |
— |
— |
— |
— |
0.98 |
2.84 |
89.4 |
0.98 |
2.84 |
89.4 |
|
Challenger Deeps (below 90mRL) |
— |
— |
— |
— |
— |
— |
0.21 |
3.50 |
23.0 |
0.21 |
3.50 |
23.0 |
| Challenger Main Open Pit |
— |
— |
— |
0.17 |
2.69 |
14.8 |
0.48 |
3.61 |
55.2 |
0.65 |
3.36 |
70.0 |
| Challenger West Open Pit |
— |
— |
— |
— |
— |
— |
0.03 |
10.7 |
11.6 |
0.03 |
10.7 |
11.6 |
| Challenger SSW Deposit |
— |
— |
— |
— |
— |
— |
0.40 |
0.95 |
12.2 |
0.40 |
0.95 |
12.2 |
| Challenger 3 Deposit |
— |
— |
— |
— |
— |
— |
— |
— |
— |
— |
— |
— |
| Tailings Storage Facility 1 |
— |
— |
— |
3.19 |
0.54 |
55.5 |
— |
— |
— |
3.19 |
0.54 |
55.5 |
| Tailings Storage Facility 2 |
— |
— |
— |
5.13 |
0.31 |
51.8 |
— |
— |
— |
5.13 |
0.31 |
51.8 |
| TOTAL |
— |
— |
— |
8.49 |
0.45 |
122 |
2.09 |
2.84 |
191 |
10.6 |
0.92 |
313 |
| * Totals subject to rounding; tonnages are dry metric tonnes; all Mineral Resources classified as ‘Inferred’ are approximate; cut-off grades applied are 2.0 (Deeps) 1.0 g/t Au (UG above 215 mRL), 0.5 g/t Au (Main Open Pit, Challenger West, SSW) and 0.0 g/t Au (TSF1 and TSF2). | ||||||||||||
Table 2 – Challenger JORC (2012) Mineral Resources Estimate (September 2025)4
3 Refer to ASX announcement dated 16 April 2026
4 Refer to ASX announcement dated 8 September 2025
Updated Tarcoola JORC (2012) MRE
During July 2024 Barton announced an updated Tarcoola MRE of 30koz Au (0.54Mt @ 1.70 g/t Au), with ~44% classified as JORC ‘Indicated’ category.5 Following remodelling, the Tarcoola MRE is now slightly revised to 29koz Au (0.53Mt @ 1.68 g/t Au), where the primary change is that ~72% is now classified as JORC ‘Indicated’ category.
Comparison with prior Tarcoola JORC (2012) MRE
Tarcoola’s updated JORC (2012) MRE (see Table 3 below) is based upon further review and validation of historical production records, and remodelling of stockpiled mineralisation for revised density assumptions. The stockpiled mineralisation has been reclassified from JORC ‘Inferred’ category to JORC ‘Indicated’ category.
| Zone |
Measured |
Indicated |
Inferred |
TOTAL |
||||||||
|
Mt |
g/t Au |
Koz Au |
Mt |
g/t Au |
Koz Au |
Mt |
g/t Au |
Koz Au |
Mt |
g/t Au |
Koz Au |
|
| Perseverance Open Pit | ||||||||||||
|
Oxide |
— |
— |
— |
— |
— |
— |
0.00 |
0.62 |
— |
0.00 |
0.62 |
0 |
|
Transitional |
— |
— |
— |
0.01 |
1.34 |
0 |
0.01 |
1.00 |
0 |
0.01 |
1.14 |
1 |
|
Fresh |
— |
— |
— |
0.18 |
2.12 |
12 |
0.11 |
1.89 |
7 |
0.30 |
2.03 |
19 |
|
Subtotal |
— |
— |
— |
0.19 |
2.10 |
13 |
0.12 |
1.82 |
7 |
0.31 |
1.99 |
20 |
| Stockpiles | ||||||||||||
|
Oxide |
— |
— |
— |
0.16 |
1.20 |
6 |
— |
— |
— |
0.16 |
1.20 |
6 |
|
Fresh |
— |
— |
— |
0.05 |
1.40 |
2 |
— |
— |
— |
0.05 |
1.40 |
2 |
|
Subtotal |
— |
— |
— |
0.22 |
1.23 |
9 |
— |
— |
— |
0.22 |
1.23 |
9 |
| TOTAL |
— |
— |
— |
0.41 |
1.63 |
21 |
0.12 |
1.82 |
7 |
0.53 |
1.68 |
29 |
| * Totals subject to rounding; tonnages are dry metric tonnes; cut-off grades applied are 0.5 g/t Au (Perseverance Pit) and 0.4 g/t Au (stockpiles). | ||||||||||||
Table 3 – Tarcoola JORC (2012) Mineral Resources Estimate (October 2026)
The prior Tarcoola JORC (2012) MRE, reported on 3 July 2024, was:5
| Zone |
Measured |
Indicated |
Inferred |
TOTAL |
||||||||
|
Mt |
g/t Au |
Koz Au |
Mt |
g/t Au |
Koz Au |
Mt |
g/t Au |
Koz Au |
Mt |
g/t Au |
Koz Au |
|
| Perseverance Open Pit | ||||||||||||
|
Oxide |
— |
— |
— |
— |
— |
— |
0.00 |
0.62 |
— |
0.00 |
0.62 |
0 |
|
Transitional |
— |
— |
— |
0.01 |
1.34 |
0 |
0.01 |
1.00 |
0 |
0.01 |
1.14 |
1 |
|
Fresh |
— |
— |
— |
0.18 |
2.12 |
12 |
0.11 |
1.89 |
7 |
0.30 |
2.03 |
19 |
|
Subtotal |
— |
— |
— |
0.19 |
2.10 |
13 |
0.12 |
1.83 |
7 |
0.31 |
1.99 |
20 |
| Stockpiles | ||||||||||||
|
Oxide |
— |
— |
— |
— |
— |
— |
0.17 |
1.20 |
7 |
0.17 |
1.20 |
7 |
|
Fresh |
— |
— |
— |
— |
— |
— |
0.06 |
1.40 |
3 |
0.06 |
1.40 |
3 |
|
Subtotal |
— |
— |
— |
— |
— |
— |
0.23 |
1.30 |
10 |
0.23 |
1.30 |
10 |
| TOTAL |
— |
— |
— |
0.19 |
2.10 |
13 |
0.35 |
1.48 |
17 |
0.54 |
1.70 |
30 |
| * Totals subject to rounding; tonnages are dry metric tonnes; cut-off grades applied are 0.5 g/t Au (Perseverance Pit) and 0.4 g/t Au (stockpiles). | ||||||||||||
Table 4 – Tarcoola JORC (2012) Mineral Resources Estimate (July 2024)5
5 Refer to ASX release dated 3 July 2024
Challenger Definitive Feasibility Study
A DFS is underway targeting an initial 3 – 4 year Stage 1 ‘baseline’ operation utilising only historical higher-grade tailings from tailings storage facility 1 (TSF1) and limited, near-surface materials without disturbing Challenger’s historical high-grade underground mine, its mineralisation or its infrastructure access.
In support of the DFS, Barton has now completed the following programs of work, among others:6
- a detailed condition assessment of the Central Gawler Mill (CGM) and supporting infrastructure;
- TSF1 geotechnical and metallurgical drilling, and comminution and metallurgical testwork;7
- a further 8,065m RC and 1,322 DD drilling;8 and
- preliminary capital and operating cost estimates (subject to scale and throughput scenario analysis).
These analyses support the conclusions that the CGM is suitable for recommissioning to operations, and that TSF1 materials reprocessing is considered technically feasible and operationally practical.9
The CGM offers a material leverage point for Barton to commence de-risked ‘Hub 1′ operations, and also materially enhances the development optionality of Barton’s regional assets including Tarcoola Gold Project (Tarcoola), Wudinna Gold Project (Wudinna) and high-grade Tolmer silver prospect (Tolmer).
All of these potential sources of mineralisation could potentially be processed through the CGM.
Follow-up analysis and drilling
Barton is continuing its analysis of potential optimal startup and development pathways for the CGM, with a preference for pathways that reduce risk. Barton is targeting DFS publication during Q1 CY27.
Remodelling of Challenger’s underground Resources, along with preliminary modelling of the underground’s other unclassified mineralisation by SRK, has also raised interesting questions about the potentially greater prospects for further Resources growth, and also for integrating this mineralisation into development plans. Barton expects to shortly commence an expedited review of potential underground development options.
Finally, review of recent drilling and updated modelling of mineralisation has identified multiple targets for potential follow-up drilling, including:
- further infill and extension of the new Challenger 3 Deposit, and infill of Challenger SSW, to convert low-risk, open pittable mineralisation into JORC ‘Indicated’ category as potential ‘baseline’ mill feed;
- further infill and extension of drilling on the Challenger ‘Main’ open pit, where the latest drilling has recently confirmed new zones of high-grade mineralisation up to 170 g/t Au in the pit walls;10 and
- drilling of Challenger’s underground targeting material volumes of mineralisation for conversion to JORC Resources classification.
The Company will provide further updates in due course.
6 Refer to ASX announcement dated 14 May 2026
7 Refer to ASX announcements dated 30 June and 8 / 29 September 2025
8 Refer to ASX announcement dated 16 April 2026
9 Refer to ASX announcement dated 14 May 2026
10 Refer to ASX announcement dated 20 April 2026
Updated Company JORC Mineral Resources Statement
Further to the updated MRE detailed in this announcement:*
- Barton’s total JORC (2012) Mineral Resources gold endowment is now 2.29Moz (80.4Mt @ 0.89 g/t Au); and
- Barton’s total JORC (2012) Mineral Resources silver endowment is now 3.1Moz (34.5Mt @ 2.80 g/t Au).
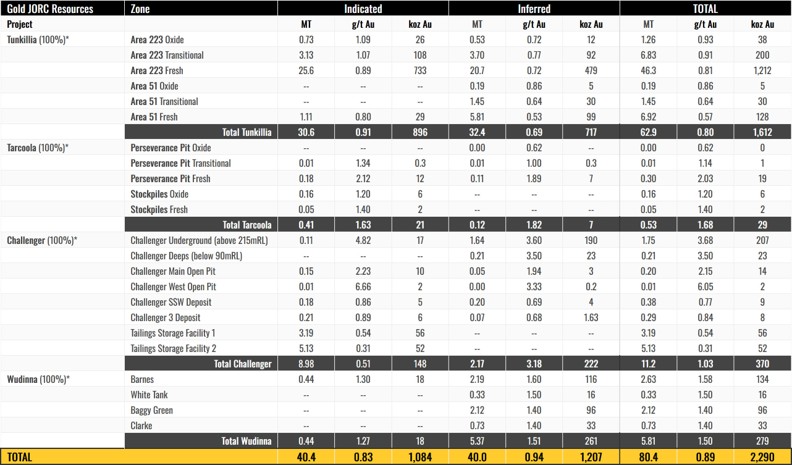

* Tables show the complete JORC MRE for each Project. Figures are subject to rounding, tonnages are dry-metric tonnes, and all Mineral Resources classified as ‘Inferred’ are approximate.
Gold cut-off grades applied are:
Tunkillia
- 0.3 g/t Au (Area 223)
- 0.3 g/t Au (Area 51)
Tarcoola
- 0.5 g/t Au (Perseverance Pit)
- 0.4 g/t Au (Stockpiles)
Challenger
- 0.3 g/t Au (Main, West, SSW, C3)
- 1.0 g/t Au (Main UG, West UG)
- 2.0 g/t Au (Deeps)
- 0.0 g/t Au (TSF1 & TSF2)
Wudinna
- 0.5 g/t Au (all Deposits)
Silver is considered as a by-product and is reported as a subset of the reported gold MRE, and has only been reported where the block model reports >0.3g/t Au.
Silver resources are reported only as Inferred resources independent of the block model classification for gold. Mineral Resources are reported using a gold price of A$3,500 / ounce.
Refer to Prospectus and ASX announcements dated 14 Oct 2021, 26 Apr 2023, 1 Sep 2023, 11 Dec 2023, 4 Mar 2024, 3 Jul 2024, and 4 Mar / 30 Jun / 2 Jul / 8 Sep 2025 and 28 October 2026 for further details of JORC (2012) Mineral Resource Estimates and Barton’s JORC (2012) Mineral Resources inventory.
Figure 2 – Barton updated JORC Gold & Silver Mineral Resources Estimates (October 2026)*
2026 Mineral Resource Estimate for the Challenger Project (above 215 Fault, ~215 m RL) and the Tarcoola Project, South Australia.
1. Summary
The Challenger gold deposit, mined as an open pit and underground operation between 2002 and 2018 and producing ~1.2 Moz gold, is located in the Gawler Craton, South Australia. It is ~730 km northwest of Adelaide, South Australia and ~130 km northwest of Tarcoola, South Australia. The Project is owned by Barton Gold Holdings Ltd (BGD) and comprises the Challenger Mine, ~650 ktpa mill/processing plant (“Central Gawler Mill”), mine camp and associated infrastructure. The Challenger gold deposit was discovered in 1995 by Dominion Mining.
The deposit is hosted within high-grade metamorphic rocks and is characterised by structurally controlled quartz veins.
The resource (Table 1) is reported within optimised pit shells and above a 0.3 g/t gold cut off, below the pit shells and above the modelled 215 Fault (~215 mRL) the resource is reported above a 1.0 g/t cut off.
Table 1. Challenger Mineral Resource Estimate 2026
|
Cut off |
Resource |
Area |
Tonnes |
Grade |
Gold (koz) |
|
> 0.3 g/t |
Indicated |
M lodes |
50,000 |
1.98 |
3.20 |
|
SEZ lodes |
96,000 |
2.36 |
7.28 |
||
|
W lodes |
10,000 |
6.66 |
2.11 |
||
|
SW lodes |
182,000 |
0.86 |
5.05 |
||
|
CH3 lode |
212,000 |
0.89 |
6.07 |
||
|
> 0.3 g/t |
Inferred |
M lodes |
50,000 |
1.98 |
3.20 |
|
SEZ lodes |
4,000 |
1.40 |
0.18 |
||
|
W lodes |
2,000 |
3.33 |
0.24 |
||
|
SW lodes |
198,000 |
0.69 |
4.39 |
||
|
CH3 lode |
74,000 |
0.68 |
1.63 |
||
|
> 1.0 g/t |
Indicated |
M lodes |
98,000 |
3.99 |
12.6 |
|
SEZ lodes |
6,000 |
2.69 |
0.52 |
||
|
W lodes |
7,000 |
19.1 |
4.02 |
||
|
> 1.0 g/t |
Inferred |
M lodes |
1,120,000 |
3.93 |
141.4 |
|
SEZ lodes |
430,000 |
2.24 |
30.86 |
||
|
W lodes |
88,000 |
6.12 |
17.39 |
||
| Total |
2,627,000 |
2.84 |
240.1 |
* Due to rounding to appropriate significant figures, minor discrepancies may occur, tonnages are dry metric tonnes. Mineral Resources are not Ore Reserves and do not have demonstrated economic viability.
Inferred resource have less geological confidence than Indicated resources and should not have modifying factors applied to them. It is reasonable to expect that with further exploration most of the inferred resources could be upgraded to indicated resources.
Significant exploration work has been undertaken to define new resources at the southwest (SW) lodes and Challenger 3 (CH3) deposits.
In addition to the above resources (Table 1) are two tailings storage facilities (TSF) on the Challenger leases and two stockpiles on the Tarcoola leases; An indicated mineral resource for the tailings storage facility is reported (no cut off, Table 2) as it is envisaged hydraulic mining (no selectivity) will be used.
Table 2. Challenger TSF Mineral Resource Estimate 2026
|
Indicated Material |
tonnes (t) |
Grade (Au g/t) |
Gold (koz) |
|
TSF1 |
3,190,000 |
0.54 |
55.5 |
|
TSF2 |
5,130,000 |
0.31 |
51.8 |
|
Total |
8,330,000 |
0.40 |
107.3 |
* Due to rounding to appropriate significant figures, minor discrepancies may occur, tonnages are dry metric tonnes. Mineral Resources are not Ore Reserves and do not have demonstrated economic viability.
Table 3. Tarcoola Stockpiles Mineral Resource Estimate 2026
| Indicated Material | tonnes (t) | Grade (Au g/t ) | Gold (koz) |
| Oxide (TLGO) | 162,000 | 1.20 | 6.3 |
| Fresh (TP) | 54,000 | 1.40 | 2.4 |
| Total | 217,000 | 1.24 | 8.7 |
2. Geology and geological interpretation
Gold mineralisation at the Challenger deposit is hosted within granulite facies gneisses and is predominantly associated with deformed quartz veins. The mineralisation is structurally controlled, occurring as high-grade shoots that plunge steeply within narrow lodes. These lodes occupy the limbs and hinge zones of a tightly deformed, isoclinal fold package approximately 500 metres in width, comprising multiple subparallel lodes. The deposit is hosted by the meta-sedimentary Christie Gneiss (2,650 Ma) within the Mulgathing Complex, part of the north-western Gawler Craton. Peak metamorphism occurred around 2,440 Ma. The presence of invisible gold in löllingite and not in adjacent arsenopyrite and the presence of spherical gold sulphide inclusions in peak metamorphic garnet and other silicates suggest an earlier mineralising event. The absence of typical alteration halos, which usually signal younger fluid-driven mineralisation, further strengthens the case for a pre-metamorphic gold event.
3. Structural Modelling and Tailings Characterisation
Building upon the work of previous tenement holders, a structural domain model of the Challenger Deposit was developed in Leapfrog software, reflecting the geometry of steeply plunging folds. Lodes were modelled using a combination of implicit ‘vein style’ and ‘intrusion style’ geometries. The shapes were constructed using explicit selection of drillhole intervals based primarily on grade, with a 0.5 g/t lower cutoff. The more complex shapes such as M1 and parts of M2 used manually digitised meshes corresponding with the central plane of each lode to generate structural trends (including the strong 30o -> 060 plunge component) that the implicit modelling could honour. The high variability in assays required that selected intervals for modelling commonly had to incorporate samples below the cut-off grade in order to maintain continuity. In the M1-M2 lodes it was recognised that face sampling in particular was a poor representation of actual grade, and these samples were not directly utilised to control shapes. In M3 and SEZ, only face samples that were roughly perpendicular to and captured width of the lode were used as shape controls, with lode-parallel wall samples being both unreliable as samples and also adding too much complexity to the modelling process.
Challenger SW deposit comprises five north‑dipping (~55°) low‑grade zones, with the largest folded into a broad antiform aligned with the structural trend of the main Challenger system. Grades are highly variable, and early dip‑parallel drilling (1998, 2012) introduces a low‑grade bias that implicit modelling has partly mitigated. Barton’s 2025 CHB drilling, with improved cross‑dip sample geometry, confirms similar variability, albeit at a lower magnitude than the dip‑parallel holes. The resulting domain uncertainty remains the principal constraint on Indicated classification.
The Challenger 3 deposit extends over ~1,000 m and strikes 47° NE. Two smaller lodes, a footwall lode (~200 m strike) and a hanging‑wall lode (~350 m strike), sit adjacent to the main structure. The footwall lode dips shallowly (~30°) toward the main lode, the main lode dips steeply (~70°) to the southeast. The hanging‑wall lode is sub‑parallel to the main lode. Of the three, only the main lode hosts mineralisation within fresh material.
Tailings volume estimations were derived from surveyor records. TSF1 hosts a higher-grade outer ring in the upper part of the dam (“beach” facies), with gold grades exceeding 0.7 g/t Au, while the inner upper and lower layers (“pond facies”) range between 0.3 and 0.5 g/t Au. The lower proportion of TSF2 exhibits grades broadly consistent with the lower-grade material from the central upper part of TSF1 and is overlain by tailings with approximately 0.2 g/t Au. TSF1 is comprised entirely of material derived from the processing of Challenger mine ore, whilst the upper 3 m of TSF2 represents co-processing of material derived from both the Challenger mine and the Perseverance mine at Tarcoola, located approximately 130 km to the SE of the Challenger mine.
Two stockpiles remain on the Run of Mine (ROM) pad at Tarcoola, the stockpiles have been upgraded from Inferred to Indicated, a thorough review of the Tarcoola Gold’s Resource and Reserve Statements (2018), reconciliation reports and end of month survey pick certificates along with the Bartons 2024 stockpile metallurgical test work were considered. The stockpile volumes were estimated from lidar surveys and assumed base of stockpile floors, volume reconciled well, the density estimate has been revised down based on assumed swell and compaction factors applied to an insitu density of 2.6 t/m3. The compacted density of 2.30 t/m³ was applied compared to the previous 2.47 t/m3.
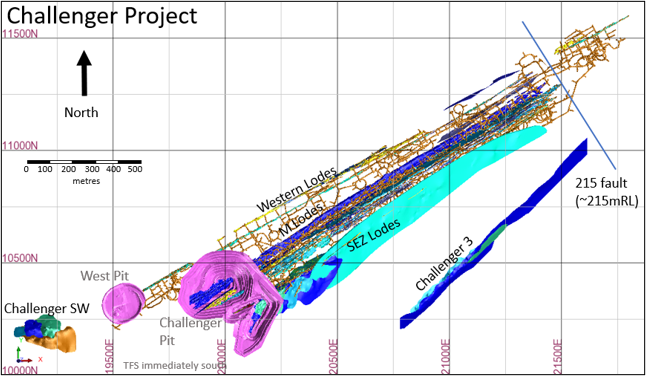
Figure 1. Challenger Project
4. Drilling techniques
Multiple drilling techniques and contractors have been used at the Challenger Project. The project has over 3,260 surface RC holes, 2,320 Underground diamond holes, 20,210 Sludge holes, 20,427 face samples and 18,989 wall samples. Face (Chip) sampling is stored as pseudo drill holes in the drill hole database making it easily combined or excluded with the diamond and sludge drilling data.
Core Drilling is widely spaced and often clustered around underground drill cuddies. Sludge and Face sampling are more prevalent and vary from 3 m spacing to 10 m along strike, Wall samples and near surface RAB samples were not used in the MRE. Careful consideration was given to the benefits and vagaries of using fewer representative samples (UDDH) compared to the use more data of a lessor quality (including face, RAB and sludge samples).The use of the larger data set provides maximum data for the grade interpolant, with face, RAB and sludge data bringing a substantial improvement to data coverage particularly in the near surface, central, high grade parts of the lodes, however, the face, RAB and sludge data are not considered representative samples and are not supported by important quality controls data such as primary sample weights and field duplicates. Face and RAB data were applied to volumetric/structural boundary definition only. Following domain construction, these datasets were removed from the estimation dataset and did not inform the grade interpolation.
Near surface Exploration drilling undertaken by BGD followed suitable protocols including certified reference materials and duplicate sampling. BGD drilled the TSF’s using both Aircore and RC drilling (150 AC holes for 2,352.8 m and 120 RC holes for 2,804 m). Aircore and RC drilling data was used for the estimation of mineral resources in TSF1, whilst only AC drilling data is available for the estimation of resources in TSF2. Correlation analysis between AC and RC derived results from TSF1 confirmed the suitability of AC-derived assay data for resource estimation.
None of the drill hole locations of historical drill holes can be verified by Barton Gold as surface drill collars have been re-habilitated and there is limited underground access. No face or wall samples can be verified due to legacy mining issues.
5. Sampling and sub-sampling techniques
All assay data used in the Challenger mine estimates has been analysed onsite using the commercial PAL1000 process. In brief this process involved Boyd crushing the sample (nominal 10 mm top size), rotary dividing a subsample of 400 g charge then pulverising the charge with steel media in a rotating steel flask along with a cyanide solution and leach accelerant in a batch of 52 samples within the PAL mill. The resulting slurry is subsampled (100 ml) and centrifuged to separate off a leachate which is then diluted and read on an AAS machine.
RC drilling by Barton Gold on TSF1 utilised a 5 ¾” (146 mm) face-sampling hammer, with a rig-mounted cone splitter attached to the cyclone providing one metre sample intervals. AC drilling on the TSF utilised an 85mm diameter face-sampling blade bit, with all samples passed through a 3-tier riffle splitter at one metre intervals.
Stockpiles underwent a grab sample program for metallurgical test work. A total 50 grab samples were collected.
6. QAQC
Drilling from October 2006 was processed through the onsite PAL laboratory at Challenger Mine. The QAQC routine includes insertion of CRM, laboratory duplicates, and round robin assaying at independent laboratories. Sampling information (recovery, moisture, method) does not appear to have been recorded.
The Challenger 2017 Mineral Resource Estimate provides a summary QAQC report, covering the drilling between 2006-2017, no material issues were reported. Data pre-2006 is scarce and there appears to have been a poor handover of data prior to this time.
RC and Aircore drilling of the TSF used QAQC insertion rates of 1 blank per 50 samples, one cone splitter field duplicate per 50 samples, and 1 CRM per 50 samples. No significant issues were identified. Four RC twins of Aircore holes were drilled, and statistical analysis conducted on the overlapping data populations. Aircore drilling was deemed to be representative for the Challenger oxide material (TSF1 lower domain), aircore over-represented grade by 10% in the high-grade upper domain (TSF1 beach), and under-represented grade by 10% in the low grade upper domain (TSF1 pond). The bias is likely a function of grain size and drill method.
7. Estimation
The geological interpretations are based on available drill hole data and face sampling. Drill core and RC chip logging has been used to define the main geological units and weathering profile boundaries near surface. Numerous small mafic to ultramafic (lamprophyre) dykes cross-cut the deposit.
The resource estimate is estimated for gold only and does not take into account contained silver. Silver is a by-product and is not analysed. The host rock is not acid generating, and the deposit has only minor arsenopyrite or base metal sulphides. Metallurgical testing has shown there are no deleterious elements (Cu, Zn, Pb, Ni, Sb) of significance.
The Mineral Resource statement reported herein is a reasonable representation of the Challenger Project mineralisation, based on pit exposures, underground mapping (to the 600 Level) and current sampling data. Grade estimation was undertaken using Geovia’s Surpac™ software package (v7.8.2). Ordinary Kriging (“OK”) was selected for grade estimation.
Five block models are used to cover the Challenger study area and to align with the geometry of the modelled lodes (Challenger_26.mdl, SEZone_26.mdl, CHSW_26.mdl, challenger_3.mdl and tailings_1.mdl). The models are strike and dip aligned, improving the volumetric representation of the sub blocks. The selected block size is consistent with data configuration, (Challenger_26 and SEZone_26 1 x 10 x 10, XYZ, CHSW_26 5 x 12.5 x 5 XYZ, Challenger_3 20 x 10 x 5 XYZ and tailings_1 24 x 24 x 1 XYZ).
Informing samples were composited to 1 m down‑hole intervals, and grade capping was applied to outlier composites on a domain‑by‑domain basis. Within the main Challenger deposit, caps ranged from 6.55 g/t to 311 g/t. Six domains required caps above 100 g/t (M1 at 311 g/t; M2‑3 at 100 g/t; M2‑4 at 205 g/t; M2‑12 at 135 g/t; M2‑14 at 214 g/t; and M3‑1 at 220 g/t). The remaining M2 domains were typically capped around ~50 g/t, while most M3 domains were capped around ~20 g/t, increasing to ~50 g/t in deeper parts of the lode.
The Challenger West lode system is a markedly higher‑tenor part of the field, with multiple lodes containing extreme grade outliers; seven domains required caps above 100 g/t (W‑8 at 132 g/t; W‑7 at 175 g/t; W‑2 at 100 g/t; W‑4 at 262 g/t; W‑5 at 167 g/t; W‑6 at 170 g/t; and W‑21 at 139 g/t). In contrast, the Challenger 3 and SW deposits are lower‑tenor systems. Grade caps at Challenger 3 ranging from 4.2 g/t to 9.3 g/t, and from 3.1 g/t to 8.2 g/t within the SW lodes.
TSF1 pond domain was capped at 0.82 g/t, the TSF1 beach was capped at 1.43 g/t, TSF2 was capped at 0.56.
Stockpile retained the historic grade controlled derived stockpile grade.
Experimental variograms were generated in Supervisor using normal‑scores transformations, with the final models back‑transformed for use in Surpac. Where experimental variograms could not be produced, models were aligned to strike and dip, with composite data reviewed in three dimensions to incorporate the plunge component into the variogram structure. Challenger variograms generally had short ranges (~30 m) while the TSF variograms had long ranges (~130 m).
A two-pass estimation process was employed, with the first pass requiring a minimum of either 4 or 8 composites and a maximum of between 8 and 18 composites depending on the size of the domain. The second pass (double the first pass) reduced the minimum composites required by half and the maximum of composites required by four-fifths. For the Challenger deposit, search ellipse ranges were defined as 30 m above the 1,000 mRL and 20 m below, reflecting the prevalence of close spaced sludge drilling deeper in the deposit. Search ranges were 50 m for the West and South‑West deposits, 60 m for Challenger 3, and 100 m for the TSF. No second pass estimation was required on the TSF model. Anisotropic ratios ranged between 1:1.33 to 1:2.2 for the semi major axis, anisotropic rations or the minor axis ranged from 1:2 to 1:6.5, the TSF variograms produced the flattest ellipses.
Block densities are allocated based on five weathering classes, with values spanning from 1.5 t/m³ in completely weathered zones to 2.72 t/m³ for fresh material, consistent with historic measurements. The TSF model was assigned 1.5 t/m3 (average of 14 BGO samples) Open pits, underground development, stopes and dykes have been excluded from the resource classification. Stockpiles were assigned a density 2.30 t/m3 derived from swell (1.20) and compaction (0.94) factors applied to an in-situ density of 2.60 t/m3.
Block model validation comprised visual checks in plan and section, global comparisons between input and output means and alternative estimation techniques.
8. Cut-off grades
The resource is reported above a 0.3 g/t gold grade within optimised pit shells with revenue factors ranging from 1.2 to 1.5, material below the optimised pit shells is reported above 1 g/t, reflecting an option to rehabilitate the existing workings and exploit the deposit from underground.
The base case assumed a gold price of $5,000 (USD$3,500), the following additional assumptions were considered.
|
Optional Presentation |
|||
|
Resource Cut Off Assumptions |
Open Pit |
Underground |
|
|
Area |
Units |
Value |
Value |
| Gold Price (Base Case) | AUD$/oz | $ 5,000.00 | |
| Gold Price | AUD$/g | $ 160.75 | |
| Recovery | % | 95% | |
| Effective Revenue | AUD$/g | $ 151.11 | |
| Less Royalty | % | 6.0% | |
| Less per g Costs | AUD$/g | $0.32 | |
| Realized Revenue | AUD$/g | $ 141.72 | |
| Cost to Mine/t | AUD$/t | $3.75 | $85.00 |
| Costs to Process | AUD$/t | $ 43.50 | $43.50 |
| Cutoff (in place) | g/t | 0.33 | 0.91 |
| Dilution | % | 10% | 15% |
| Resource Cutoff Grade | g/t | 0.37 | 1.04 |
Deeper resources are reported above 1 g/t to reflect the increased cost of underground mining, a general mining cost of $85/tonne was considered, other considerations remain consistent. The tailings material will likely be hydraulically mined, and as such will have no mining selectivity. Mining costs are assumed to be $1.50/t and only regrind processing is considered ($10/t).
9. Resource Classification
No measured resources remain within the Challenger Deposit.
The Indicated Mineral Resource may be developed on a single level, providing reasonable evidence of the lode in development. The data density and quality are insufficient to fully define structural complexity or continuity. Specifically, 25-metre spaced diamond drilling lacks the resolution required to delineate metre-scale parasitic folding. The broader drill spacing complicates confident correlation of intercepts to specific segments of the mineralised system. The dataset typically comprises a 20 × 20 m diamond‑drill grid, supplemented by 5-10 m ring‑spaced sludge drilling and face sampling at 3-4 m intervals. Face samples assist in confirming geological continuity and lode interpretation, but they are excluded from the estimation dataset. This spatial configuration provides adequate confidence in the geological interpretation and grade continuity to support classification as Indicated, aligning with the JORC Code (2012) requirement that the nature, quality, and quantity of data are sufficient to assume geological continuity with reasonable confidence.
The TSF resource is classified as Indicated, based on a drill spacing of approximately 35 m x 35 m. Grade distribution approximates a normal curve with low coefficients of variation, consistent with the expected homogenisation resulting from grade-controlled mill feed followed by grinding and processing a slurry through the CIL plant.
The Inferred Mineral Resource is based on drill‑limited data, including sludge rings data, and only modest or no underground development. While the available information is sufficient to infer the presence of lode structures, geological and grade continuity cannot be reliably established due to sparse and variable assay results. Drill spacing is not systematic, and classification may rely on a single intercept or on sludge samples alone, provided the mineralisation can be reasonably interpreted as part of a broader structure.
The Inferred Mineral Resource also includes deeper parts of the model that lie near existing development and historical stoping, as well as remnants, pillars, and low‑grade mineralisation where reasonable prospects for eventual economic extraction exist, albeit with some economic risk related to accessibility. Inferred Mineral Resources have a lower level of confidence than Indicated Mineral Resources and must not be converted to Ore Reserves, though they may be used in Scoping Studies. It is reasonably expected that most Inferred Mineral Resources could be upgraded to Indicated with continued exploration, improved sampling techniques, targeted underground mapping, and further interpretive work in areas demonstrating economic potential to better resolve geological and grade continuity.
10. Mining and Metallurgical Factors:
Barton Gold foresees mining via open pit and underground methods, followed by conventional grinding and leach recovery. The current Mineral Resource does not include any dilution or ore loss associated with practical mining constraints. The Challenger mineralisation sampled has been shown to be amenable to direct cyanidation for gold extraction. The Challenger Deposit was processed on site through the CIL plant between 2002 and 2018, after which the plant was placed on care and maintenance. Historical recoveries exceed 95% via gravity and CIL processing. No deleterious elements reported. Initial BGD test work on the tailing’s material indicates that at a 70% recovery is achievable with a finer regrind (38 µm).
11. Environmental and Tenure:
The Challenger Project, comprises two mine leases (ML 6103, ML 6457) and three Miscellaneous purposes licences (MPL 63, MPL 65, MPL 66)
The project operates under approved mining leases with current environmental permits. There are no known impediments to continued operations at the Challenger mine. The waste material is non-acid generating and will be stockpiled on site in designated waste dumps.
Mr I.A. Taylor
BSc Hons (Geology), G.Cert.(Geostats), FAusIMM (CP) MAIG.
Brisbane, Australia
Date: 22 October 2026
Authorised by the Board of Directors of Barton Gold Holdings Limited.
| Alexander Scanlon Managing Director a.scanlon@bartongold.com.au +61 425 226 649 |
Jade Cook Company Secretary cosec@bartongold.com.au +61 8 9322 1587 |
Competent Persons Statements
The information in this announcement that relates to the new estimate of Mineral Resources for the Challenger Gold Project geological interpretation and resource estimates) is based upon, and fairly represents, information and supporting documentation compiled by Mr Ian Taylor BSc (Hons). Mr Taylor is an employee of Mining Associates Pty Ltd and has acted as an independent consultant on Barton Gold’s Challenger Gold Project, South Australia. Mr Taylor is a Fellow and certified Professional of the Australian Institute of Mining and Metallurgy (FAusIMM (CP Geo) 110090) and has sufficient experience with the style of mineralisation, the deposit type under consideration and to the activity being undertaken, to qualify as a Competent Person as defined in the 2012 Edition of the “Australasian Code for Reporting of Exploration Results, Mineral Resources and Ore Reserves” (The JORC Code). Mr Taylor consents to the inclusion in this announcement of the matters based upon this information in the form and context in which it appears.
The information in this announcement that relates to the new estimate of Mineral Resources for the Tarcoola Gold Project geological interpretation and resource estimates) is based upon, and fairly represents, information and supporting documentation compiled by Mr Ian Taylor BSc (Hons). Mr Taylor is an employee of Mining Associates Pty Ltd and has acted as an independent consultant on Barton Gold’s Tarcoola Gold Project, South Australia. Mr Taylor is a Fellow and certified Professional of the Australian Institute of Mining and Metallurgy (FAusIMM (CP Geo) 110090) and has sufficient experience with the style of mineralisation, the deposit type under consideration and to the activity being undertaken, to qualify as a Competent Person as defined in the 2012 Edition of the “Australasian Code for Reporting of Exploration Results, Mineral Resources and Ore Reserves” (The JORC Code). Mr Taylor consents to the inclusion in this announcement of the matters based upon this information in the form and context in which it appears.
|
Challenger Gold Project
Tarcoola Gold Project
Tunkillia Gold Project
Wudinna Gold Project
|
 |
Competent Persons Statement & Previously Reported Information
The information in this announcement that relates to the historic Exploration Results and Mineral Resources as listed in the table below is based on, and fairly represents, information and supporting documentation prepared by the Competent Person whose name appears in the same row, who is an employee of or independent consultant to the Company and is a Member or Fellow of the Australasian Institute of Mining and Metallurgy (AusIMM), Australian Institute of Geoscientists (AIG) or a Recognised Professional Organisation (RPO). Each person named in the table below has sufficient experience which is relevant to the style of mineralisation and types of deposits under consideration and to the activity which he has undertaken to quality as a Competent Person as defined in the JORC Code 2012 (JORC).
| Activity | Competent Person | Membership | Status |
| Tarcoola Mineral Resource (Stockpiles) | Dr Andrew Fowler (Consultant) | AusIMM | Member |
| Tarcoola Mineral Resource (Perseverance Mine) | Mr Ian Taylor (Consultant) | AusIMM | Fellow |
| Tarcoola Exploration Results (until 15 Nov 2021) | Mr Colin Skidmore (Consultant) | AIG | Member |
| Tarcoola Exploration Results (after 15 Nov 2021) | Mr Marc Twining (Employee) | AusIMM | Member |
| Tunkillia Exploration Results (until 15 Nov 2021) | Mr Colin Skidmore (Consultant) | AIG | Member |
| Tunkillia Exploration Results (after 15 Nov 2021) | Mr Marc Twining (Employee) | AusIMM | Member |
| Tunkillia Mineral Resource | Mr Ian Taylor (Consultant) | AusIMM | Fellow |
| Challenger Mineral Resource (above 215mRL) | Mr Ian Taylor (Consultant) | AusIMM | Fellow |
| Challenger Mineral Resource (below 90mRL) | Mr Dale Sims | AusIMM / AIG | Fellow / Member |
| Wudinna Mineral Resource (Clarke Deposit) | Ms Justine Tracey | AusIMM | Member |
| Wudinna Mineral Resource (all other Deposits) | Mrs Christine Standing | AusIMM / AIG | Member / Member |
About Barton Gold
Barton Gold is an ASX, OTC and Frankfurt Stock Exchange listed Australian gold developer targeting future gold production of 150,000ozpa with 2.3Moz Au & 3.1Moz Ag JORC Mineral Resources (80.4Mt @ 0.89g/t Au), brownfield mines, and 100% ownership of the region’s only gold mill in the renowned Gawler Craton of South Australia.*
The information relating to historic Exploration Results and Mineral Resources in this announcement is extracted from the Company’s Prospectus dated 14 May 2021 or as otherwise noted in this announcement, available from the Company’s website at www.bartongold.com.au or on the ASX website www.asx.com.au. The Company confirms that it is not aware of any new information or data that materially affects the Exploration Results and Mineral Resource information included in previous announcements and, in the case of estimates of Mineral Resources, that all material assumptions and technical parameters underpinning the estimates, and any production targets and forecast financial information derived from the production targets, continue to apply and have not materially changed. The Company confirms that the form and context in which the applicable Competent Persons’ findings are presented have not been materially modified from the previous announcements.
Cautionary Statement Regarding Forward-Looking Information
This document may contain forward-looking statements. Forward-looking statements are often, but not always, identified by the use of words such as “seek”, “anticipate”, “believe”, “plan”, “expect”, “target” and “intend” and statements than an event or result “may”, “will”, “should”, “would”, “could”, or “might” occur or be achieved and other similar expressions. Forward-looking information is subject to business, legal and economic risks and uncertainties and other factors that could cause actual results to differ materially from those contained in forward-looking statements. Such factors include, among other things, risks relating to property interests, the global economic climate, commodity prices, sovereign and legal risks, and environmental risks. Forward-looking statements are based upon estimates and opinions at the date the statements are made. Barton undertakes no obligation to update these forward-looking statements for events or circumstances that occur subsequent to such dates or to update or keep current any of the information contained herein. Any estimates or projections as to events that may occur in the future (including projections of revenue, expense, net income and performance) are based upon the best judgment of Barton from information available as of the date of this document. There is no guarantee that any of these estimates or projections will be achieved. Actual results will vary from the projections and such variations may be material. Nothing contained herein is, or shall be relied upon as, a promise or representation as to the past or future. Any reliance placed by the reader on this document, or on any forward-looking statement contained in or referred to in this document will be solely at the readers own risk, and readers are cautioned not to place undue reliance on forward-looking statements due to the inherent uncertainty thereof.
* Refer to Barton Prospectus dated 14 May 2021 and ASX announcement dated 28 October 2026. Total Barton JORC (2012) Mineral Resources include 1,084koz Au (40.4Mt @ 0.83 g/t Au) in Indicated category and 1,207koz Au (40.0Mt @ 0.94 g/t Au) in Inferred category, and 3,070koz Ag (34.5Mt @ 2.80 g/t Ag) in Inferred category as a subset of Tunkillia gold JORC (2012) Mineral Resources.
JORC Table 1 – Challenger Gold Project & Tarcoola Gold Project
Section 1 Sampling Techniques and Data
|
Criteria |
Commentary |
||||||||||||||||||||||||||||||||||||||||||
|---|---|---|---|---|---|---|---|---|---|---|---|---|---|---|---|---|---|---|---|---|---|---|---|---|---|---|---|---|---|---|---|---|---|---|---|---|---|---|---|---|---|---|---|
|
Sampling techniques Nature and quality of sampling (e.g. cut channels, random chips, or specific specialised industry standard measurement tools appropriate to the minerals under investigation, such as down hole gamma sondes, or handheld XRF instruments, etc.). These examples should not be taken as limiting the broad meaning of sampling. Include reference to measures taken to ensure sample representivity and the appropriate calibration of any measurement tools or systems used. Aspects of the determination of mineralisation that are Material to the Public Report. In cases where ‘industry standard’ work has been done this would be relatively simple (e.g. “RC drilling was used to obtain 1 m samples from which 3 kg was pulverised to produce a 30 g charge for fire assay”). In other cases, more explanation may be required, such as where there is coarse gold that has inherent sampling problems. Unusual commodities or mineralisation types (e.g. submarine nodules) may warrant disclosure of detailed information |
Challenger open pit and underground resources All primary samples used in the estimate are from either diamond drilling and included chip sampling and sludge drilling where available, or from RC drilling completed in early 2026. Core has been whole core sampled for UG BQ drilling or half core sampled for NQ surface drilling. The sample volume for the half NQ sample is approximately 13% lower than the whole core BQ sample. Face samples weigh between 2 and 5 kg. Sludge samples are collected from 78 mm open production holes. The open hole is capped by the stuffing box of the sludge rig, allowing for sample collection. No second half core sampling or other formal sampling imprecision work on primary sampling has been undertaken. Primary samples are not weighed. The deposit contains particulate gold and has a high level of imprecision in the data based on duplicate crushed material subsampling results in work undertaken by the onsite laboratory. Based on the current nature of the drillhole assay data and its distribution/location the models produced can only be used for a global estimate and are suitable for Scoping level Studies. It is considered that for better local estimation larger primary sample volumes are required given the particulate gold present in the deposit (whole HQ core or UG RC drilling). Face chip and open hole percussion ‘sludge’ samples have been collected for grade control during the mine’s operation. Analysis of their subsampling and analytical imprecision indicates they have similar imprecision to DDH data. There is no sampling QAQC data from chip sampling or sludge drilling, yet they have been included to increase the number of available samples for interpolation given sampling and assay imprecision in the data. Sampling during Barton Gold’s 2026 RC drill programs at Challenger was obtained through the reverse circulation (RC) method. One-metre splits were constrained by chute and butterfly valves to derive a 2-4kg split on the cyclone. 3m composite samples were also collected from the upper parts of drill holes where gold mineralisation was not anticipated as informed by previous drilling results, to be assayed as check on confirmation of no materially significant mineralisation being present. 3m samples were submitted for laboratory analysis at Bureau Veritas (Adelaide). The samples were analysed by method FA1 where the 2-3kg split sample received at the laboratory is weighed, dried, crushed to 10mm, pulverized to 75 micron and split to provide a 40g sample for fire assay analysis. 1m samples were submitted for laboratory analysis at Australian Laboratory Service (ALS). The sample preparation was conducted by ALS (Adelaide) using methods CRU-32a & SPL-32a where samples are weighed, dried, crushed to -5mm and a nominal 500g split derived. Splits are analysed by ALS (Perth) using the photon assay method (Au-PA01). Tailings Storage Facilities (TSF’s) Aircore (AC) &/or reverse circulation (RC) drilling was used to obtain 1m samples from which nominal 7kg (AC) or 20kg (RC) samples were obtained, to derive a 40g charge for fire assay analysis of gold. |
||||||||||||||||||||||||||||||||||||||||||
|
Drilling techniques Drill type (e.g. core, RC, open-hole hammer, rotary air blast, auger, Bangka, sonic, etc.) and details (e.g. core diameter, triple or standard tube, depth of diamond tails, face-sampling bit or other type, whether core is oriented and if so, by what method, etc.). |
Challenger open pit and underground resources Diamond drilling data used is dominantly whole core BQ /LTK48 with some half core NQ drilling in surface holes. Sparce surface holes are the only data below ~70RL. Oriented core has not been used in underground drilling. Surface drilling has been oriented with a spear technique, but the data was not available for this work. All surface drilling has been single shot electronic surveyed on 30m nominal intervals. Sludge drilling was a routine grade control process and utilised a converted underground blasthole rig drilling 76mm diameter holes. Holes were drilled through a collar stuffing box established within an oversize collar hole. Samples were collected into a rotating sample bag holder below the stuffing box outlet. Sample weights were not collected. Sludge holes were dominantly steeply inclined into the backs of the drives. 2026 RC drilling by Barton Gold used a face-sampling 5 ¾” RC drilling technique undertaken by Kennedy Drilling using a SREPS SR650 drilling rig with auxiliary compressor delivering a nominal 1000psi / 2200cfm air. Drill holes were surveyed using the OMNIx42 north seeking gyro orientation system at 5m intervals down hole. Tailings Storage Facilities (TSF’s) AC & RC drilling was undertaken on TSF1 to derive samples for assaying and metallurgical investigations. AC drilling only was undertaken on TSF2. |
||||||||||||||||||||||||||||||||||||||||||
|
Drill sample recovery Method of recording and assessing core and chip sample recoveries and results assessed. Measures taken to maximise sample recovery and ensure representative nature of the samples. Whether a relationship exists between sample recovery and grade and whether sample bias may have occurred due to preferential loss/gain of fine/coarse material. |
Challenger open pit and underground resources Recovery data was collected at the logging stage with core loss logged as a specific lithology. The gneissic host rock and gold bearing quartz veining is very competent and core loss is not significant based on a review of the database and core photos from past underground and surface drilling. As loss is a logged interval, it is not assayed as no sample exists in total loss zones. Where core loss resulted in poor core (low RQD) assays do occur in core loss affected intervals the average grade in the database is 3 g/t Au No relationship between grade and recovery has been identified in previous work. RC drilling Drilling recoveries were qualitatively described for each drilled interval in the field database along with an estimation of moisture content. In general recoveries were good, in the order of 25-35kg for each one-metre interval. Minor water was encountered in some drill holes and moist samples comprise <1% of sampling overall. No reduced sample weights were recorded with moist intervals and a review of results does not indicate contamination between adjacent samples. Samples submitted to the laboratory were weighed on a dry, as-received basis and reported along with assay results. No relationship between grade and recovery has been identified Tailings Storage Facilities (TSF’s) Drilling recoveries were qualitatively described for each drilled interval in the field database along with an estimation of moisture content. Poor recovery was generally confined to (waste rock) sheeting above TSF1. No relationship between grade and recovery has been identified in previous work. |
||||||||||||||||||||||||||||||||||||||||||
|
Logging Whether core and chip samples have been geologically and geotechnically logged to a level of detail to support appropriate Mineral Resource estimation, mining studies and metallurgical studies. Whether logging is qualitative or quantitative in nature. Core (or costean, channel, etc.) photography. The total length and percentage of the relevant intersections logged. |
Challenger open pit and underground resources All drill core is geologically (lithology, mineralisation, structure) and geotechnically (Q-system) logged down to cm-scale (for fine structures). Any leucosome greater than 0.20m in length is recorded as a separate lithology. The logging is quantitative in nature as lithology percentages and compositions are recorded and all geotechnical logging relies on measurements for calculation of Q. All RC samples have a portion washed and placed into a chip tray for logging. This logging comprises qualitative geological records (lithology and mineralisation) on a sample scale (generally 1 m samples). All Sludge samples have a portion washed and placed into a chip tray for logging. This logging comprises qualitative geological records (lithology and mineralisation) on a sample scale (generally 0.75-0.90m samples). As sludge drilling was done as a part of the production cycle, the chips were retained for a maximum of six months (the maximum ‘life cycle’ of any particular stope block) before being discarded. No photographs are retained of the sludge chips. Tailings Storage Facilities (TSF’s) Barton Gold Aircore drilling of tailings facility material was not logged. All Barton Gold RC drilling of tailings facility material (TSF1) was electronically logged for lithology, weathering and colour. Metre-by metre samples are stored in chip trays which are photographed and electronically stored. Data is stored in an MS Access database. |
||||||||||||||||||||||||||||||||||||||||||
|
Subsampling techniques and sample preparation If core, whether cut or sawn and whether quarter, half or all core taken If non-core, whether riffled, tube sampled, rotary split, etc. and whether sampled wet or dry. For all sample types, the nature, quality and appropriateness of the sample preparation technique. Quality control procedures adopted for all subsampling stages to maximise representivity of samples. Measures taken to ensure that the sampling is representative of the in-situ material collected, including for instance results for field duplicate/second-half sampling. Whether sample sizes are appropriate to the grain size of the material being sampled. |
Challenger open pit and underground resources The full dataset is used (diamond drilling samples plus chip and sludge samples). Core has been whole core sampled for UG BQ drilling or half core sampled for NQ2 surface drilling. The sample volume for either sample is approximately equal. No second half core sampling or other formal sampling imprecision work on primary sampling has been undertaken. The deposit contains particulate gold and has a high level of imprecision in the assay data based on duplicate crushed material subsampling results from work undertaken by the onsite laboratory. The RC drilling program used an Ox sampling system cone splitter mounted on the cyclone with one-metre splits constrained by chute and butterfly valves to derive a 2-4kg split on the cyclone. The majority (>99.5%) of samples were dry and when samples were wet they were recorded in the sampling records. Field Duplicate samples are collected from a second chute from the cone splitter, which otherwise discards this portion of sample. Duplicate sampling was undertaken through targeted zones of mineralisation at a ratio of 1 in 2 samples, with 1 in 6 duplicates samples (ie 1 in 12 overall) submitted for initial analysis with the remaining samples retained for future analysis if warranted. Certified reference materials (CRMs) and coarse (field) blanks were included in the sampling sequence at a ratio of 1 in 50 each. The sampling, assaying and quality control workflows are considered to be appropriate to the style of mineralisation being assessed. Tailings Storage Facilities (TSF’s) AC samples were collected from the drill rig cyclone and passed through a 3-tier riffle splitter to derive 1m samples between 1-2kg in weight. RC samples were derived from a cone splitter mounted beneath the cyclone to produce samples weighing approximately 1-2kg. The majority of samples (>97%) from all TSF drilling were dry. Duplicate samples were routinely collected for both AC and RC drilling utilising the sample splitting methods. |
||||||||||||||||||||||||||||||||||||||||||
|
Quality of assay data and laboratory tests The nature, quality and appropriateness of the assaying and laboratory procedures used and whether the technique is considered partial or total. For geophysical tools, spectrometers, handheld XRF instruments, etc., the parameters used in determining the analysis including instrument make and model, reading times, calibrations factors applied and their derivation, etc. Nature of quality control procedures adopted (e.g. standards, blanks, duplicates, external laboratory checks) and whether acceptable levels of accuracy (i.e. lack of bias) and precision have been established. |
Challenger open pit and underground resources All pre-Barton sample types at Challenger are assayed on-site using the PAL1000 process which uses accelerated Cn leaching of a ~400 g crushed aliquot during pulverisation within a steel flask using grinding media plus an accelerant tablet. This technique has been applied due to the recognised high nugget of the deposit yet yields imprecise and at times biased data. Primary samples are crushed to -10mm top size then rotary sample divided (RSD) to produce the flask charge. The resultant slurry is subsampled to ~100 ml and centrifuged with the leachate then diluted and read for Au via an AAS instrument. As only leachable gold is recovered in the process the method is considered ‘partial’ although no indications of refractory/nonleachable Au were reported or recognised over the mine life. Duplicate samples (1:25) indicate a high level of imprecision and bias in the primary assay vs duplicate. The bias is thought to be due to poor subsampling practices where operators hand grab material circumventing the effective working of the RSD. CRM materials also run through the process indicate sporadic accuracy issues and blanks indicate a level of material carry over between flask charges can occur in the process. External fire assay (FA) checks indicate an overall bias between PAL1000 data and external lab data where original PAL data is biased high compared to FA data. This is thought to be largely due to the larger charge size better capturing the nuggety gold (~400 g v 50 g). Biases in subsampling errors when obtaining the check samples from crushed residues should also be considered. RC drilling The fire assay method and photon assay method are both complete digestion and analysis methods. The photon assay method, when used in combination with RC drilling to derive a systematic reduced sample from a large primary sample, enables production of results considered more representative and with greater precision (repeatability) than the fire assay method. The fire assay is still considered appropriate for providing assessment, particularly in areas outside of predicted mineralisation. Quality control (QC) procedures are described under subsampling techniques and preparation and the results of the QC analysis have confirmed acceptable levels of accuracy and precision in the results. Tailings Storage Facilities (TSF’s) 1-2kg splits were sent to Bureau Veritas in Adelaide for preparation and analysis using a fire assay technique for gold. Bureau Veritas’ FA1 method uses a 40g lead collection fire assay with AAS finish to a 0.01 ppm detection limit. Barton Gold’s RC and AC programs includes a comprehensive QAQC component with Field Duplicate samples taken at intervals of every 50th sample; Certified Standards (selection of OREAS CRM’s considered most appropriate for expected grade and composition) were inserted at frequencies of every 50th sample submitted; blanks inserted in sequence at every 50th sample submitted. Additionally, the laboratories provided their internal QAQC which included check samples, CRM’s, blanks and repeats. No geophysical studies were used in the course of Barton Gold drilling programs. |
||||||||||||||||||||||||||||||||||||||||||
|
Verification of sampling and assaying The verification of significant intersections by either independent or alternative company personnel. The use of twinned holes. Documentation of primary data, data entry procedures, data verification, data storage (physical and electronic) protocols. Discuss any adjustment to assay data. |
Challenger open pit and underground resources PAL1000 assays are duplicated during the primary batch at 1:25 (termed R1 assays) but are also duplicated on request (termed R2 assays) to verify assays over 2 g/t Au. R2 sample requests also include flanking intervals. Analysis of original assay / R1 and original assay / R2 paired data for the Challenger Deeps area indicates original samples are around 7% higher grade on average than R1 duplicates and 13% higher than R2 duplicates. These biases are believed to come from improper subsampling where hand grabbing of duplicate ‘splits’ from crushed residue bags reduces fines content. Imprecision is a material issue for the data as is relatively small aliquot in the PAL1000 compare to the ‘industry standard’ of total sample preparation by pulverising mill. The verification of specific significant intersections is difficult in this high nugget environment where 50-60% of gold is recovered in the gravity circuit. No holes within Challenger Mine are twinned, data processing and management uses an access database. Alternative company personnel have verified significant intersections from the 2026 drilling program contributing to the MRE. No twinned holes were undertaken on the programs included in this MRE. All data collected in the reported program including collar details, drilling records, sampling records and geological logs are recorded directly into spreadsheets in the field which includes comprehensive interval validation processes. Tailings Storage Facilities (TSF’s) Four AC holes were twinned with RC on TSF1, with 73 sample pairs show a good correlation between drilling methods. RC results returned a +ve bias in samples less than 0.8 g/t and AC assays returned a +ve bias in samples above 0.8 g/t with all quantiles within 10% error bars. Significant intersections were reviewed and verified by alternative company personnel. |
||||||||||||||||||||||||||||||||||||||||||
|
Location of data points Accuracy and quality of surveys used to locate drillholes (collar and downhole surveys), trenches, mine workings and other locations used in Mineral Resource estimation. Specification of the grid system used. Quality and adequacy of topographic control. |
Challenger open pit and underground resources All drillhole collars have been surveyed in by site surveyors using total station equipment. Underground drilling has used the mine survey control system to establish drill hole, sludge and chip sample location. Surface drilling within Challenger Deeps has hole lengths of 1500-1600m. Survey errors in long holes compound creating locational uncertainty particularly critical for narrow lode deposits such as at Challenger. This locational uncertainty can impact confidence in interpretation where lode intercepts cannot be confidently correlated over long distances/depths. Data is located within a metric grid based on the surveyed mine coordinate system. For grid conversion see the prior public report (2017 resource statement, local -> AMG). Topographic control is not critical in this environment as the terrain is very flat and the site under survey control due to mining activity / statutory requirements. 2026 RC drilling Gyro downhole surveys (at 10m intervals) and assay results were provided in digital format. No adjustments were made to any assay data. All RC drill collars were sited using a hand-held DGPS system. The co-ordinates of completed drill holes are updated following survey pickup of drill holes using a Leica DGPS system with 0.01m horizontal accuracy. Tailings Storage Facilities (TSF’s) Collar positions for TSF drill holes were set out with a differential GPS utilising UTM co-ordinates in the GDA94 (EPSG:4283) datum. Challenger Mine Reduced Level (RL) = AHD + 1000m so AHD 193m level = 1193mRL. Transformations between AMG84 (EPSG:20353) and local grids: origin, azimuth AMG origin and azimuth conversions are based on the following coinciding points.
Challenger Mine Grid North 0° = 329.0° MAGNETIC Challenger Mine Grid North 0° = 333° 14’41” AMG84 (EPSG:20353) (grid bearing + 26°45’19” = AMG84 (EPSG:20353) bearing) Challenger Mine Grid 31° = Magnetic North 0° |
||||||||||||||||||||||||||||||||||||||||||
|
Data spacing and distribution Data spacing for reporting of Exploration Results. Whether the data spacing and distribution is sufficient to establish the degree of geological and grade continuity appropriate for the Mineral Resource and Ore Reserve estimation procedure(s) and classifications applied. Whether sample compositing has been applied. |
Challenger open pit and underground resources Data spacing in the resource areas are variable and in general significantly less in the Challenger Deeps (former) resource below 90 mRL than in the Remnants around production areas. Diamond drilling is on a nominal 20-25m vertical x 10-15m horizontal grid while chip sampling exists on most faces and along sidewalls on 3m intervals. Sludge drilling is on 10-20m spaced up-hole rings along drives. Sampling intervals has been dominantly 1 m in diamond drilling, RC drilling and face chips while sludge drilling has been sampled on 0.8-1.0 m intervals. Tailings Storage Facilities (TSF’s) Drill holes for evaluating the TSFs were undertaken on an equidimensional 50m x 50m spacing which is considered appropriate for the style of mineralisation contained with the TSF’s. No sample compositing has been applied. |
||||||||||||||||||||||||||||||||||||||||||
|
Orientation of data in relation to geological structure Whether the orientation of sampling achieves unbiased sampling of possible structures and the extent to which this is known, considering the deposit type. If the relationship between the drilling orientation and the orientation of key mineralised structures is considered to have introduced a sampling bias, this should be assessed and reported if material. |
Challenger open pit and underground resources Diamond drilling platforms were limited underground, and so highly skewed angles can exist between the drillhole and lodes on the extremities of the pattern coverage. In general, drillhole intercepts in the remnant areas are at high angles to the lodes and so are well oriented for lode definition. Face sampling is ideally located across lode trends given drives follow the orebody. Wall sampling and sludge drilling is less optimally oriented often located along or parallel to the structure and its boundaries. All lode models were primarily developed on drilling data with local adjustments made using sub-optimally oriented data where required. Lode trends are well established from mining activity on the levels above and below and interpretation. In general, the lode boundary models show a high level of geological continuity and the shoots are strongly anisotropic. The RC drill holes were oriented to optimally test predicted mineralised structures and positions. The majority of drill holes were drilled on sections perpendicular to the strike of mineralisation, with some adjustments required on account of logistical constraints dictated by existing surface infrastructure availability of drilling sites. No material bias has been introduced on account of drilling orientations and subsequent modelling will account for variations in the drilling orientations with respect to the modelled mineralisation. On account of the complex, variable and sometimes steeply dipping orientation to mineralised lodes, most reported intersections will be inconsistent with respect to true width of mineralisation. Tailings Storage Facilities (TSF’s) Mineralisation in the TSFs follows sedimentary depositional processes and vertical drilling suitably achieves unbiased sampling. |
||||||||||||||||||||||||||||||||||||||||||
|
Sample security The measures taken to ensure sample security. |
Challenger open pit and underground resources Samples were not transported off site for analysis, so the chain of sample custody was very short. Sample submission paperwork was used for all batches submitted to the onsite lab. 2026 RC drilling Barton Gold staff oversaw the sampling on the RC drill rig and maintained oversight of sample security whilst onsite during the drilling programs. Split samples were inserted into pre-printed calico bags. These tied bags were, in batches of 5, ziplocked into labelled poly-weave bags which were inserted into ziplocked Bulka-bags. The bulka bags were strapped onto pallets and either transported and delivered to the laboratory by Barton Gold personnel, or loaded by a Barton Gold representative on to a semitrailer for transport to the laboratories in Adelaide. The trailers were not unloaded whilst in transit. Tailings Storage Facilities (TSF’s) Barton Gold staff oversaw the sampling on the AC &RC drill rigs and maintained oversight of sample security whilst onsite during the drilling programs. Split samples were inserted into pre-printed calico bags. These tied bags were, in batches of 5, ziplocked into labelled poly-weave bags which were inserted into Bulka-bags. The bulka bags were strapped onto pallets and either transported and delivered to the laboratory by Barton Gold personnel or loaded by a Barton Gold representative on to a semitrailer for transport to the laboratories in Adelaide. The trailers were not unloaded whilst in transit. |
||||||||||||||||||||||||||||||||||||||||||
|
Audits or reviews The results of any audits or reviews of sampling techniques and data |
Challenger open pit and underground resources A review of the operation in 2018 by SRK Consulting found no concerns with assay data. A more recent internal peer review of the exploration data processes has been completed by Barton Gold which has included a detailed review of the assay, survey and QAQC data. Tailings Storage Facilities (TSF’s) Sampling techniques and data was reviewed by the independent consultant in the preparation of a Mineral Resource Estimate using the TSF data sets. |
||||||||||||||||||||||||||||||||||||||||||
Section 2 Reporting of Exploration Results
|
Criteria |
Commentary |
|---|---|
|
Mineral tenement and land tenure status Type, reference name/number, location and ownership including agreements or material issues with third parties such as joint ventures, partnerships, overriding royalties, native title interests, historical sites, wilderness or national park and environmental settings. The security of the tenure held at the time of reporting along with any known impediments to obtaining a licence to operate in the area. |
All Challenger mineral resources are contained within ML6103 and ML6457 (“Challenger Deeps”, not reported in this release). The Mining Leases (ML’s) are held 100% by a wholly-owned subsidiary company of Barton Gold Holdings Ltd (Barton). . The Mining Lease is covered by a registered Native Title determination held by the Antakirinja Matu-Yankunytjatjara Aboriginal Corporation (AMYAC. AMYAC have the benefit of a production royalty for gold produced from the Challenger ML’s. The Challenger tenements lie within the Mobella pastoral lease. There are no conservation reserves or areas with elevated environmental value with the Challenger tenements. The Challenger tenements lie with the Woomera Prohibited Area (WPA) and Barton maintains the required approvals to operate within the WPA. There are no known risks to the security of the Challenger tenements at the time of reporting and there are established statutory processes under the SA Mining Act to facilitate the renewal of the Challenger tenements at the end of their current terms. There are no known impediments to obtaining future licences. |
|
Exploration done by other parties Acknowledgment and appraisal of exploration by other parties. |
Challenger open pit and underground resources The data used for the estimation and reporting of mineral resources in this release includes that produced by the various operators of the Challenger Gold Mine since its discovery in 1995 and operations between 2002-2018, prior to being placed under care and maintenance. The data has been appraised as fit for purpose with relevant commentary contained within these JORC tables. Tailings Storage Facilities (TSF’s) No previous appraisal of the TSF’s has previously been undertaken. |
|
Geology Deposit type, geological setting and style of mineralisation. |
Challenger open pit and underground resources Challenger occurs within the Mulgathing Complex of the Gawler Craton and the area is characterized by Archaean to mid-Proterozoic gneissic country rock. Original granulite facies metamorphism is overlaid by retrograde amphibolite facies recrystallization around 1650 – 1540 Ma (Tomkins, 2002). Saprolitic clays extended to 50 m depth within the ore zone, reflecting a deeper base of oxidation. High-grade gold mineralisation is associated with coarse-grained quartz veins with feldspar, cordierite and sulphides dominated by arsenopyrite (and related löllingite) , pyrrhotite and lesser telluride. These veins are interpreted as migmatites that have undergone partial melting, with this melting reflecting a precursor hydrothermal alteration event (McFarlane, Mavrogenes and Tomkins, 2007). Three main types of leucosome/vein styles have been defined: 1. quartz dominant veins, which may be remnant premetamorphic mineralised veins 2. polysilicate veins, which are dominant in the main ore zones and host the majority of the mineralisation 3. pegmatitic veins, which are unmineralised, late stage, with cross-cutting relationships. The gold mineralisation is structurally controlled through emplacement of the partial melt into relatively low-strain positions. McFarlane, Mavrogenes and Tomkins (2007), using Monazite geochronology proposed a 40 Ma period between 2460 and 2420 Ma of repeated high-temperature events. The Challenger Structure can be defined as a laterally extensive shear zone with shoots that plunge 30° to 029° (AMG). These ore shoots are defined by leucosome veins, which are characteristically ptygmatically folded. The small-scale folding is parasitic to the overall larger scale folding that can be interpreted from drill core. The folding is interpreted as prepeak metamorphism along with gold mineralisation. Post-folding, the Challenger shoots were subjected to extreme WNW-ESE shortening and extension directed shallowly to the NE. Reference: Androvic, P, Bamford, P, Curtis, J, Derwent, K, Giles, A, Gobert, R, Hampton, S, Heydari, M, Kopeap, P and Sperring, P, 2013. Challenger Gold Mine, Australasian Mining and Metallurgical Operating Practices, AusIMM. 1097-1112. Tailings Storage Facilities (TSF’s) TSF1 comprises material derived entirely from the Challenger main pit and initial underground workings. TSF2 is predominantly comprised of material derived from Challenger underground ore, with the upper 3m comprising co-processed material from the Perseverance Mine at Tarcoola, located approximately 130km to the SE of the Challenger Mine. Tailings volume estimations were derived from surveyor records. TSF1 hosts a higher-grade outer ring in the upper part of the dam (“beach” facies), with gold grades exceeding 0.7 g/t Au, while the inner upper and lower layers (“pond facies”) range between 0.3 and 0.5 g/t Au. The lower proportion of TSF2 exhibits grades broadly consistent with the lower-grade material from the central upper part of TSF1 and is overlain by tailings with approximately 0.2 g/t Au. |
|
Drillhole information A summary of all information material to the understanding of the exploration results including a tabulation of the following information for all Material drillholes:
If the exclusion of this information is justified on the basis that the information is not Material and this exclusion does not detract from the understanding of the report, the Competent Person should clearly explain why this is the case. |
Challenger open pit and underground resources The drilling results referred to in this release relate to an existing mining area with extensive previous drilling. All previous drilling relevant to providing material context to the current estimate have been used. No new exploration results relating to the Challenger mine deposits are reported in this release. Tailings Storage Facilities (TSF’s) Drill collars for the AC and RC drilling reported in this release are provided in Table 1, appended to this release. |
|
Data aggregation methods In reporting Exploration Results, weighting averaging techniques, maximum and/or minimum grade truncations (e.g. cutting of high grades) and cut-off grades are usually Material and should be stated. Where aggregate intercepts incorporate short lengths of high grade results and longer lengths of low grade results, the procedure used for such aggregation should be stated and some typical examples of such aggregations should be shown in detail. The assumptions used for any reporting of metal equivalent values should be clearly stated. |
Challenger open pit and underground resources Samples are commonly collected on 1 m intervals, Down hole sample intervals were composited to one metre lengths (length weighted). High grade outliers were determined for each estimation domain, and threshold caps were applied. Two extreme high-grade outliers were quarantined before grade capping analysis, the resulting top cut determined was applied to all samples (including the quarantined samples). No metal equivalents were calculated. |
|
Relationship between mineralisation widths and intercept lengths These relationships are particularly important in the reporting of Exploration Results. If the geometry of the mineralisation with respect to the drillhole angle is known, its nature should be reported. If it is not known and only the down hole lengths are reported, there should be a clear statement to this effect (e.g. “downhole length, true width not known”). |
Challenger open pit and underground resources The geometry of the mineralisation is well understood. Drill hole angles relative to known mineralisation is highly variable due to the constrained nature of underground drilling. Underground drill fans from predetermined drill cuddies offer a variety of drill intercept angles. A 3D interpretation honouring the drill holes (snapped to drill holes) is the only suitable option. RC drillholes have been designed to intersect the mineralisation zone as perpendicular as possible. Tailings Storage Facilities (TSF’s) The vertical drilling on the TSF’s accurately reflects the true thickness of mineralisation. |
|
Diagrams Appropriate maps and sections (with scales) and tabulations of intercepts should be included for any significant discovery being reported These should include, but not be limited to a plan view of drillhole collar locations and appropriate sectional views. |
See Figures included the body of this Announcement. Relevant commentary relating to diagrams is discussed under the heading of Balanced Reporting. |
|
Balanced reporting Where comprehensive reporting of all Exploration Results is not practicable, representative reporting of both low and high grades and/or widths should be practiced to avoid misleading reporting of Exploration Results. |
No exploration results are reported. |
|
Other substantive exploration data Other exploration data, if meaningful and material, should be reported including (but not limited to): geological observations; geophysical survey results; geochemical survey results; bulk samples – size and method of treatment; metallurgical test results; bulk density, groundwater, geotechnical and rock characteristics; potential deleterious or contaminating substances. |
|
|
Further work The nature and scale of planned further work (e.g. tests for lateral extensions or depth extensions or large-scale step-out drilling). Diagrams clearly highlighting the areas of possible extensions, including the main geological interpretations and future drilling areas, provided this information is not commercially sensitive. |
Challenger open pit and underground resources Further work is required to expand the resource model to cover the existing mine workings beneath 215 mRL Fault and to increase the confidence of mineralisation in some locations (ie increasing from inferred to indicated) |
Section 3 Estimation and Reporting of Mineral Resources
|
Criteria |
Commentary |
|---|---|
|
Database integrity Measures taken to ensure that data has not been corrupted by, for example, transcription or keying errors, between its initial collection and its use for Mineral Resource estimation purposes. Data validation procedures used. |
Challenger open pit and underground resources Logging data is recorded on laptops and transferred to the access database with validation steps by the geology department. Similarly, digital assay files are also transferred internally from the onsite, in-house laboratory then loaded and validated by the geology department. Written data validation procedures were not sighted. The mine was in operation for over 13 years with established procedures for data management. Tailings Storage Facilities (TSF’s) The database is currently managed by Barton Gold using MS Access. There is no historical drilling data pertaining to the TSFs. Basic database validation checks were run, including collar locations, drill holes plot on topography, checks for missing intervals, overlapping intervals and hole depth mismatches. |
|
Site visits Comment on any site visits undertaken by the Competent Person and the outcome of those visits. If no site visits have been undertaken indicate why this is the case. |
A site visit was undertaken by the CP on the 23rd and 24th of September 2026. The Competent Person reviewed three drill holes (2 at Challenger and one from SW) were reviewed for lithology, mineralisation style, drill recovery, and geotechnical characteristics. Challenger Underground workings, development faces, stope panels, and ore drives were inspected to verify geological interpretation, mining method execution, and reconciliation practices. The northern wall of SEZ pit was inspected to gauge correlations between the wider surface exposure and the underground exposure (upper levels of SEZ lode). The project is well established, with a long history of mining. |
|
Geological interpretation Confidence in (or conversely, the uncertainty of) the geological interpretation of the mineral deposit. Nature of the data used and of any assumptions made. The effect, if any, of alternative interpretations on Mineral Resource estimation. The use of geology in guiding and controlling Mineral Resource estimation. The factors affecting continuity both of grade and geology. |
Challenger open pit and underground resources The lode arrangement, trends, continuity, and models are interpreted using understanding from prior experience mining the deposit on the levels above and/or below. Lodes were modelled on diamond drilling data with significant adjustment to account for face chip and sludge data. The constraining lodes for the mineralisation have proved to be extremely continuous on a broad scale due to the highly dominant structural control on the deposit. The shoots have been mined or traced for over 2,400 m down plunge and across a major fault offset (215 level fault) yet the distribution of grade within lodes is considered difficult to model (high Coefficient of variations within individual lodes) and predict locally based on diamond and sludge drilling data; this is attributed to the high nugget of the mineralisation and subsequent sampling and assay data imprecision. Lode models were based on a combination of geology and grade data. The approach was to model the structure across its full width and not sub-domained into higher grade intervals or shoots within the structure. The sampling and assay imprecision requires a ‘whole of structure’ approach as modelling discrete high-grade zones will likely overstate high grade continuity and hence Au metal. Consideration was given to the width and extents of observed shoots; search ellipses and the number of informing samples were restricted to reflect trends in the raw data. Within each modelled structure, natural breaks in mineralisation could be observed and several sub-domains were defined between these consistent low grades breaks within the larger structural domain. M1 is one continuous lode, M2 has 16 sub domains, M3 has 12 sub domains and SE Zone has 4 Sub domain areas. West lode has eight sub domains and SW has one low grade and one higher grade sub domain. Once the lode envelopes were modelled grades were then estimated within the domain using the lode envelope as a hard boundary constraint with a trend based on the lodes local geometry to guide anisotropy (dynamic anisotropy). Sample grades across the modelled contact shows a sharp contact between very weakly mineralised country rock. The lodes boundaries and the 0.5 g/t Au grade threshold is considered appropriate for mineralised lode definition in preference to a higher threshold. Two sets of barren dykes, mafic and lamprophyre, cross-cut the lodes have been removed from the resource classification. Tailings Storage Facilities (TSF’s) The geological characteristics of the TSFs are previously described under the Geology heading of Section 2: Reporting of Exploration Results. |
|
Dimensions The extent and variability of the Mineral Resource expressed as length (along strike or otherwise), plan width, and depth below surface to the upper and lower limits of the Mineral Resource. |
Challenger open pit and underground resources The areas of interest include lodes which variably extend from the top of fresh rock near surface down to the 215 level (215 mRL), a minor offsetting structure in the deposit. The structural lodes continue and have been mined down to below the 215 fault (a major offsetting structure), This area is considered to be the Challenger Deeps lodes and are known to extend 600 m down plunge with a further 360 m of lode interpreted to extend below to base of mining Tailings Storage Facilities (TSF’s) TSF1 has a footprint at the upper surface of approximately 370m diameter and is equidimensional. TSF2 has an irregular shape and forms part of an integrated landform with the adjacent TSF1 and waste rock facilities. It has a long axis length of approximately 550m at surface (NW-SE) and orthogonal width to this of approximately 500m at surface (NE-SW). The thickness of tailings in TSF1 ranges from 17m-21m, noting there is a 2m capping of waste rock emplaced on top of the TSF as part of previous site remediation work. The thickness of tailings in TSF2 ranges from ~14-17m. There is no capping on TSF2. The rock constructed access is removed from the estimated volumes. Both TSF facility had central decant wells installed during their construction with access provided by a rock-constructed access way. |
|
Estimation and modelling techniques In the case of block model interpolation, the block size in relation to the average sample spacing and the search employed. Any assumptions behind modelling of selective mining units. Any assumptions about correlation between variables. Description of how the geological interpretation was used to control the resource estimates. Discussion of basis for using or not using grade cutting or capping. The process of validation, the checking process used, the comparison of model data to drill hole data, and use of reconciliation data if available. |
Grades estimation is by Ordinary Kriging constrained by wireframe models of the lodes. Input data is a combined DDH, sludge and chip sampling database for the estimates above the 215 mRL. Sample length was standardised (composited) at 1m however sample diameter/volume varies within and between the data types. Extreme sample grades were removed from the outlier analysis, outliers and extreme samples were controlled via top cutting / capping No cut-off grade was applied to the estimation of the TSF mineral resource as it is assumed hydraulic mining methods will be deployed which will result in all material being mined and processed. Accordingly, there are no bounding limits to the mineral resource other than the bounding structure of the TSF’s Data imprecision, spacing and lode interpretation / location at depth due to sparse data and potential survey error remain major uncertainties in the estimates. Modelling of domains was undertaken in Leapfrog and spatial analysis and grade estimation undertaken in Surpac. Sample length was standardised (composited) at 1m however |
|
Moisture Whether the tonnages are estimated on a dry basis or with natural moisture, and the method of determination of the moisture. |
Tonnages are based on dry tonnes. Dry bulk density has been assigned to the host rocks. |
|
Cut-off parameters The basis of the adopted cut-off grade(s) or quality parameters applied. |
Challenger open pit and underground resources The resource is reported above a 0.3 g/t Au lower cut-off. Considering likely open pit mining, conventional heap leach or CIL processing and administration costs a head grade of 0.3 g/t is assumed profitable. Key Assumptions: • 1.4 m minimum mining width (2 x sub block width), • Open Pit Mining and Processing cost of AUD$30.86/tonne for mineralised material. . • Underground Mining and Process cost of AUD $125/tonne for mineralised material. • Mining and Process cost of AUD $13/tonne for tailings. • Gold price AUD 5000/oz • 94% Metallurgical recovery from hard rock • 70% Metallurgical recovery of tailings • 5.0% Dilution Open Pit, 15% Dilution Underground • 6.0% Royalty These assumptions are in line with costs used in the Tunkillia Scoping Study, reported previously by Barton Gold in 2025. Tailings Storage Facilities (TSF’s) A bulk density value of 1.5t/m3 was assigned to the TSF resource models. Bulk density was determined empirically by an acquisition program of 14 soft sediment cores (spread widely from across TSF2) which were collected and analysed to determine dry weights and corresponding volumes to calculate dry bulk densities. |
|
Mining factors or assumptions Assumptions made regarding possible mining methods, minimum mining dimensions and internal (or, if applicable, external) mining dilution. It is always necessary as part of the process of determining reasonable prospects for eventual economic extraction to consider potential mining methods, but the assumptions made regarding mining methods and parameters when estimating Mineral Resources may not always be rigorous. Where this is the case, this should be reported with an explanation of the basis of the mining assumptions made. |
Challenger open pit and underground resources No mining factors or assumptions have been applied to the resource. MA considers the near surface Challenger project amenable to open pit mining methods and assumes the likely mining scenario will have 5 m benches and 2.5 m flitches. Below the potential open pit, access to the deposit is via rehabilitated decline. The mine has been dewatered down to the 300 level. These assumptions have influenced, composite length, block size and resource cut off parameters. Tailings Storage Facilities (TSF’s) Hydraulic mining methods have been assumed for the future mining of the TSF resources. Hydraulic mining is largely non-selective and it is assumed all TSF material will be extracted. |
|
Metallurgical factors or assumptions The basis for assumptions or predictions regarding metallurgical amenability. It is always necessary as part of the process of determining reasonable prospects for eventual economic extraction to consider potential metallurgical methods, but the assumptions regarding metallurgical treatment processes and parameters made when reporting Mineral Resources may not always be rigorous. Where this is the case, this should be reported with an explanation of the basis of the metallurgical assumptions made. |
Challenger open pit and underground resources No metallurgical factors have been applied to the in-situ grade estimates. Metallurgical Recovery is assumed, and a 95% gold recovery is used in the reasonable prospects of economic extraction analysis, no account of silver recovery is considered. Tailings Storage Facilities (TSF’s) Barton commissioned Pitch Black group to determine the recovery potential of the contained gold whilst also assessing the impact of potentially deleterious elements within the dormant tailings storage facilities. (Challenger TSF Metallurgical Test Work Report, April 2025) Recovery was determined to be 70% at a 38µm grind. |
|
Environmental factors or assumptions Assumptions made regarding possible waste and process residue disposal options. It is always necessary as part of the process of determining reasonable prospects for eventual economic extraction to consider the potential environmental impacts of the mining and processing operation. While at this stage the determination of potential environmental impacts, particularly for a greenfields project, may not always be well advanced, the status of early consideration of these potential environmental impacts should be reported. Where these aspects have not been considered this should be reported with an explanation of the environmental assumptions made. |
The Challenger Project has been the subject of past historic mining and mineral processing activities on site. Environmental baseline mapping has not identified any matters that are likely to preclude the future development of a mining operation that requires the on-site management of wastes and process residues (waste rock and process tailings). The consideration of a conventional open-cut/underground mining and CIP gold processing operation, including associated ancillary activities and stand-alone infrastructure, fits within the scope of the South Australian government’s approval frameworks and processes for a project such as the Challenger Project. |
|
Bulk Density Whether assumed or determined. If assumed, the basis for the assumptions. If determined, the method used, whether wet or dry, the frequency of the measurements, the nature, size and representativeness of the samples. The bulk density for bulk material must have been measured by methods that adequately account for void spaces (vugs, porosity, etc), moisture and differences between rock and alteration zones within the deposit. Discuss assumptions for bulk density estimates used in the evaluation process of the different materials. |
Challenger open pit and underground resources Bulk Density (BD) of material at Challenger Gold Mine has been determined in two phases. The initial BD value for the Challenger rock mass was determined during the mine feasibility study, based on core samples from 1,200 to 1,090 mRL and was determined to be 2.72 for the Christie Gneiss, which comprises the Challenger deposit. A second pass of SG calculations were conducted in 2012 to determine if the SG had changed with depth. 158 samples were taken from the 320 to 240 mRL levels of both Gneiss and intrusive materials. As the host rocks of the Challenger deposit do not have any voids or variation in moisture content, these factors have not been taken into account. It was found that the SGs at the base of the mine comprise: o Gneiss SG = 2.86 o Lamprophyre SG = 2.92 o Mafic SG = 2.91 2017 resource statement reported past reconciliation tonnes for the mine to EOM April 2016 are 99% against the mill. It has been decided to apply: o Completely weathered 1.5 o Highly weathered 2.3 o Moderately weathered 2.5 o Slightly weathered 2.7 o Fresh material 2.72 Tailings Storage Facilities (TSF’s) 12 samples from 4 sites across TSF2 were used to determine bulk density with a value of 1.5t/m3 assigned to all the TSF materials. The bulk density values were derived empirically as described in Section 1 of this JORC table under the heading “Other substantive Exploration Data (bulk density)”. |
|
Classification The basis for the classification of the Mineral Resources into varying confidence categories. Whether appropriate account has been taken of all relevant factors (ie relative confidence in tonnage/grade estimations, reliability of input data, confidence in continuity of geology and metal values, quality, quantity and distribution of the data). Whether the result appropriately reflects the Competent Person’s view of the deposit. |
Challenger open pit and underground resources Data distribution, development and estimation parameters along with the specific considerations below were used to determine resource classification. Indicated
Inferred
The extensive use of face and sludge data has resulted in significant proportions of the estimate classified as Inferred Resources. Tailings Storage Facilities (TSF’s) The TSF resource is classified as Indicated, based on a drill spacing of approximately 35 m x 35 m. Grade distribution approximates a normal curve with low coefficients of variation, consistent with the expected homogenisation resulting from grade-controlled mill feed followed by grinding and processing a slurry through the CIL plant. |
|
Audits or reviews The results of any audits or reviews of Mineral Resource estimates. |
There has been no independent audit of the data or mineral resources. |
|
Discussion of relative accuracy/confidence Where appropriate a statement of the relative accuracy and confidence level in the Mineral Resource estimate using an approach or procedure deemed appropriate by the Competent Person. For example, the application of statistical or geostatistical procedures to quantify the relative accuracy of the resource within stated confidence limits, or, if such an approach is not deemed appropriate, a qualitative discussion of the factors that could affect the relative accuracy and confidence of the estimate. The statement should specify whether it relates to global or local estimates, and, if local, state the relevant tonnages, which should be relevant to technical and economic evaluation. Documentation should include assumptions made and the procedures used. These statements of relative accuracy and confidence of the estimate should be compared with production data, where available. |
No geostatistical confidence limits have been estimated. The relative accuracy and confidence in the Mineral Resource Estimate is reflected in the Resource Categories. The ordinary kriging result, due to the high level of smoothing, should only be regarded as a global estimate, and is suitable as a life of mine planning tool. Grade capping and tight search ellipses were used to restrict the influence of high-grade composites. Inferred Mineral Resource has a lower level of confidence than that applying to an Indicated Mineral Resource and must not be converted to an Ore Reserve. Should local estimates be required for detailed mine scheduling, the employment of techniques such as Uniform conditioning or conditional simulation should be considered, ultimately larger underground samples and grade control drilling is required. The Challenger Deposit was discovered in 1995 and mined from 2002 and 2018 producing ~1.2 Moz gold. |
SOURCE: Barton Gold Holdings Limited
View the original press release on ACCESS Newswire
Media gallery